Sea level rise on the Dutch coast has increased
In collaboration with the Royal Netherlands Meteorological Institute (KNMI), Deltares today presented the four-yearly report about the observed sea level on the Dutch Coast. Improved techniques for analysis were used to determine the effect of wind on sea level more accurately. The conclusions about sea level rise are therefore more robust. The most striking result is that the increase of sea level rise can now also be seen on the Dutch coast.
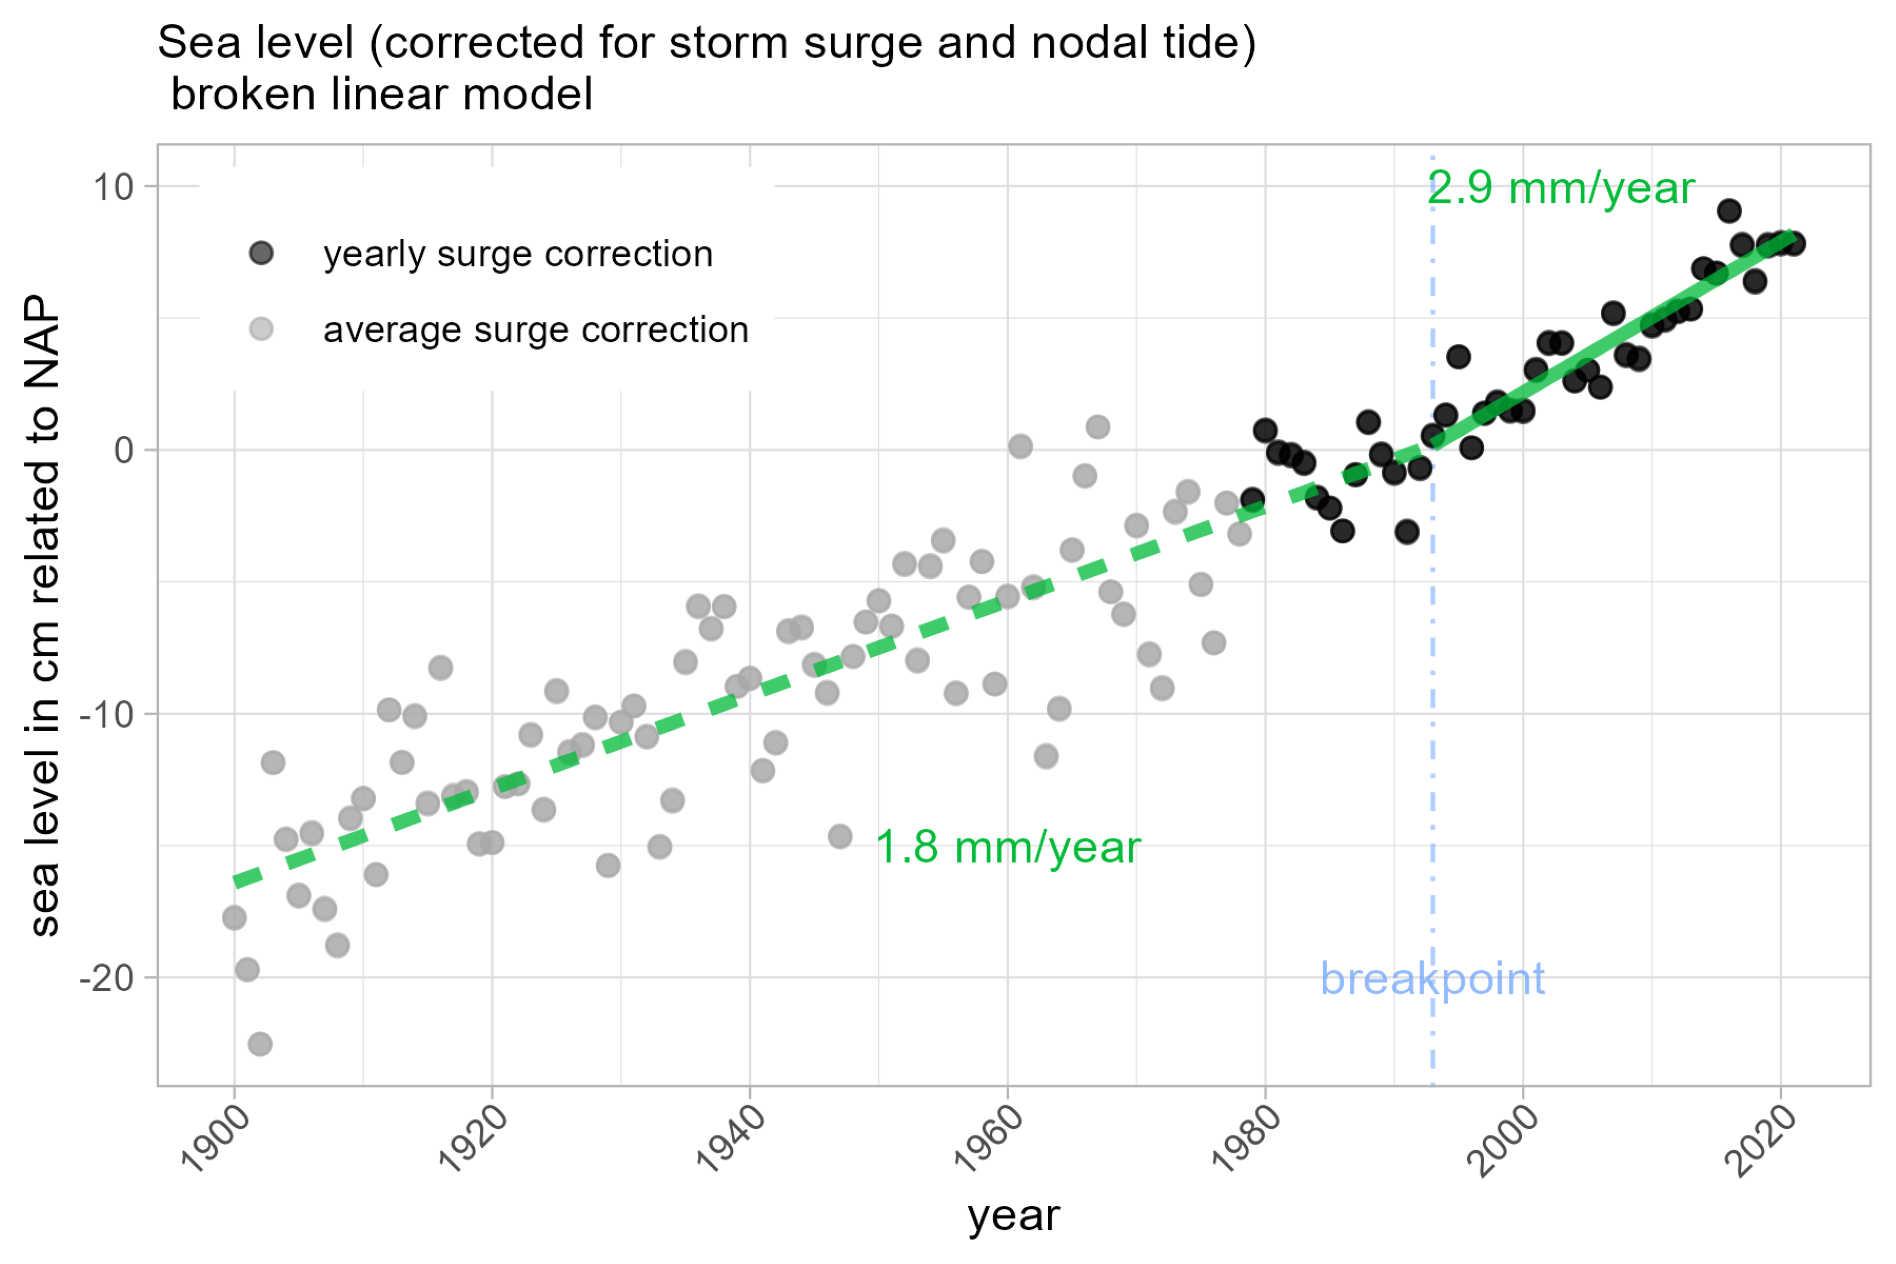
In the two previous reports, sea level rise was represented well by a constant trend since measurements began in 1890. The latest observations change this picture. The sea level on the Dutch coast can now best be described by a trend of 1.8 mm/year until thirty years ago, and an increased average annual rise of 2.9 mm/year during the past thirty years. This acceleration is consistent with what we know about global trends in sea level rise.
Since 2014, Deltares has been updating the Sea Level Monitor for the Ministry of Infrastructure and Water Management. The monitor determines the status and development of the sea level in order to support policies for flood risk management. The results of the Sea Level Monitor are used to determine, among other things, the annual requirement for sand nourishment. The monitor also plays a role in the assessment and design of the primary flood defences.
The annual sea level status is based on observations at the six main tidal stations in the Netherlands (Delfzijl, Harlingen, Den Helder, IJmuiden, Hoek van Holland and Vlissingen).
Using a new method, the influence of wind on annual mean water levels can now be determined more accurately for the years after 1979. The level of uncertainty in the data in this Sea Level Monitor has therefore been reduced, making the description of local sea level rise in recent periods more reliable.
Monitoring the sea level is extremely important for the Netherlands. The Sea Level Monitor provides us with a good picture of the current rise on the Dutch coast. Rijkswaterstaat and KNMI will continue to monitor sea level rise closely in the coming years.
—————————-
Link to report Sea Level Monitor 2022 (in Dutch only).