


Abstract
Uncertainties in the rate and magnitude of sea-level rise (SLR) complicate decision making on coastal adaptation. Large uncertainty arises from potential ice mass-loss from Antarctica that could rapidly increase SLR in the second half of this century. The implications of SLR may be existential for a low-lying country like the Netherlands and warrant exploration of high-impact low-likelihood scenarios. To deal with uncertain SLR, the Netherlands has adopted an adaptive pathways plan. This paper analyzes the implications of storylines leading to extreme SLR for the current adaptive plan in the Netherlands, focusing on flood risk, fresh water resources, and coastline management. It further discusses implications for coastal adaptation in low-lying coastal zones considering timescales of adaptation including the decisions lifetime and lead-in time for preparation and implementation. We find that as sea levels rise faster and higher, sand nourishment volumes to maintain the Dutch coast may need to be up to 20 times larger than to date in 2100, storm surge barriers will need to close at increasing frequency until closed permanently, and intensified saltwater intrusion will reduce freshwater availability while the demand is rising. The expected lifetime of investments will reduce drastically. Consequently, step-wise adaptation needs to occur at an increasing frequency or with larger increments while there is still large SLR uncertainty with the risk of under- or overinvesting. Anticipating deeply uncertain, high SLR scenarios helps to enable timely adaptation and to appreciate the value of emission reduction and monitoring of the Antarctica contribution to SLR.
Export citation and abstract BibTeX RIS

Original content from this work may be used under the terms of the Creative Commons Attribution 3.0 licence. Any further distribution of this work must maintain attribution to the author(s) and the title of the work, journal citation and DOI.
1. Introduction
Worldwide, decision makers in low-lying coastal zones are confronted with uncertainties about future sea-level rise (SLR). About 10% of the world's population lives in coastal zones that are less than 10 m above mean sea level [1]. These low and fertile areas provide food for hundreds of millions of people, have high ecological value, form major logistic hubs, and host megacities including New York, Tokyo, Jakarta, Ho Chi Minh City, Rio de Janeiro, Manilla, Lagos, Dhaka, London, and Amsterdam-Rotterdam. Higher sea levels increase the risk of coastal flooding and erosion, and reduce fresh water availability [2–4]. Without appropriate adaptation, SLR can have serious consequences for both coastal zones and global economy [5]. The large range of potential future sea levels poses, however, the question: 'When and how much to adapt?'
To deal with uncertainties about the future and to minimize regret of investment decisions as the future unfolds, decision makers are urged to take an adaptive approach [6–9]. Over the last years several frameworks have been put forward to design adaptive strategies, including robust decision making [10, 11], adaptive policy making [12, 13], dynamic adaptive policy pathways [9, 14] and engineering options analysis [15, 16]. These approaches all share the idea to identify present and future uncertainties, to evaluate vulnerabilities and alternative solutions, to take necessary actions on the short-term, and to monitor changes to gather insights indicating that new decisions or reassessments are required.
Prominent applications of an adaptive approach to uncertain SLR include the UK with the Thames Estuary study to protect the city of London [17], and New Zealand with a national guidance to coastal adaptation [18]. In the Netherlands an adaptive approach has been put into practice for adaptation to SLR within the Delta Program [19, 20]. This nation-wide program aims to prepare the Netherlands for future climate change and socio-economic developments. The designed adaptive plan exists of short-term actions and pathways anticipating mid- to long-term options for SLR, currently benchmarked by a SLR range between 0.35 and 1 m in 2100. To monitor SLR and other relevant changes that may signal implementation or adjustment of the adaptive plan, a group of experts (called Signal Group) was installed to detect relevant climate change and socio-economic signals [21–23].
Similar to other coastal zones, the Dutch Delta Program relies on SLR-assessments from the Intergovernmental Panel on Climate Change (IPCC), which are further tailored to local scenarios [24]. Over the past decades, SLR scenarios from the IPCC were fairly stable, envisaging a global mean SLR up to 1.1 m between 1990 and 2100 [25, 26] with a likely range (representing at least 66% probability) of 0.26–0.98 m in the IPCC Fifth Assessment Report [27]. In the recent Special Report on Oceans and Cryosphere in a changing Climate (SROCC) [28], the upper bound of the likely range was adjusted upwards to 1.1 m in 2100 for a high emission scenario (Representative Concentration Pathway (RCP) 8.5). However, there is a low probability that SLR will be higher due to accelerated ice sheet melting [29–31]. The magnitude and rate of this rise depends strongly on the global and regional temperature change, altered oceanographic dynamical patterns near Antarctica, and the corresponding response of the Antarctica ice cap, which are all closely linked to greenhouse gas emissions [32–34]. While the probability of such a scenario is low, plausible high-end scenarios are vital for regions with a low uncertainty tolerance [8] (e.g. when there is a large value at risk) and for decisions with a long lead and functional lifetime. This is particularly the case in the Netherlands, where flood protection against highly uncertain events (up to 1 in 100.000 year [35]) is in its culture, especially since the 1953 storm surge inundated the southwest coast and killed over 1800 people [36].
Recent studies have formulated physically plausible mechanisms leading to high-end SLR scenarios [29, 30, 37–40]. Together with observations of mass-loss of the West-Antarctic Ice sheet [41–44] and accelerated SLR [45–48], these studies have increased the concerns about elevated risk to adverse SLR impacts. An important mechanism contributing to these high-end scenarios is an accelerated ice mass-loss from Antarctica and Greenland as a result of combined surface and basal melt. Additionally, there are two possible instabilities in Antarctica, the Marine Ice Sheet Instability (MISI) [49] and the Marine Ice Cliff Instability (MICI) [29]. MISI in Antarctica and/or irreversible loss of the Greenland ice sheet can be triggered at a global temperature increase of 1.5 °C–2 °C [38, 50, 51]. As global carbon emissions need to decline strongly to stay below a temperature increase of 2 °C [50], acceleration of ice sheet contributions to SLR is becoming a plausible scenario. Some studies suggest Antarctic ice sheet instability is already contributing to the observed mass-loss [43, 52]. A recent expert judgment study [53] argues that a global SLR of 2 m by 2100 lies within the 90% confidence range given a strong global temperature increase scenario.
Despite the growth of scientific studies about Antarctica, its contribution to future rate of SLR is still highly uncertain and undergoing a strong scientific debate [30]. In fact, the uncertainty in projected SLR increased recently [26, 53]. In decision making literature this is referred to as 'deep uncertainty' [10], which occurs when experts do not have sufficient knowledge or when parties to a decision cannot agree upon the system processes and futures. The adaptive approach is typically designed for such a situation.
In response to the aforementioned studies and observations, the experts from the Delta Program Signal Group signaled the plausibility of a SLR acceleration, that would result in a SLR which is outside the current boundary conditions of the adaptive plan [23]. Because of the potential high-impact of this signal, the Delta Program committed a study to assess the potential consequences of accelerated SLR for the adaptive plan of the Netherlands, despite the large uncertainty.
The objective of this paper is to assess the potential consequences of a high and accelerated SLR scenario for coastal adaptation in the Netherlands, focusing on coastline, flood risk and fresh water resources management. This study contributes to high-end scenario impact and adaptation studies [54–56] by explicitly assessing the impacts of high rates of change and the increased uncertainty on when, how much and how fast to adapt in low-lying coastal zones considering timescales of adaptation. Timescales of adaptation include the lifetime of decisions and the time required for planning and implementation. We use projections for the Antarctic ice sheet contributions with a SLR of 1.1–2 m in 2100 (median values) along the Dutch coast as a low likelihood but plausible high-end scenario while acknowledging that there is still no consensus in the scientific community about the probability of reaching such large SLR before the end of the 21st century. We find that high and accelerated SLR scenarios may lead to a very short time to adapt, which can have large consequences for decision making, even for a well-protected country like the Netherlands. Our study shows how high-end scenarios can be used in adaptive pathways planning, and why this is relevant for short-term decisions affecting low-lying urbanized coastal zones.
2. The Netherlands and the Delta Program
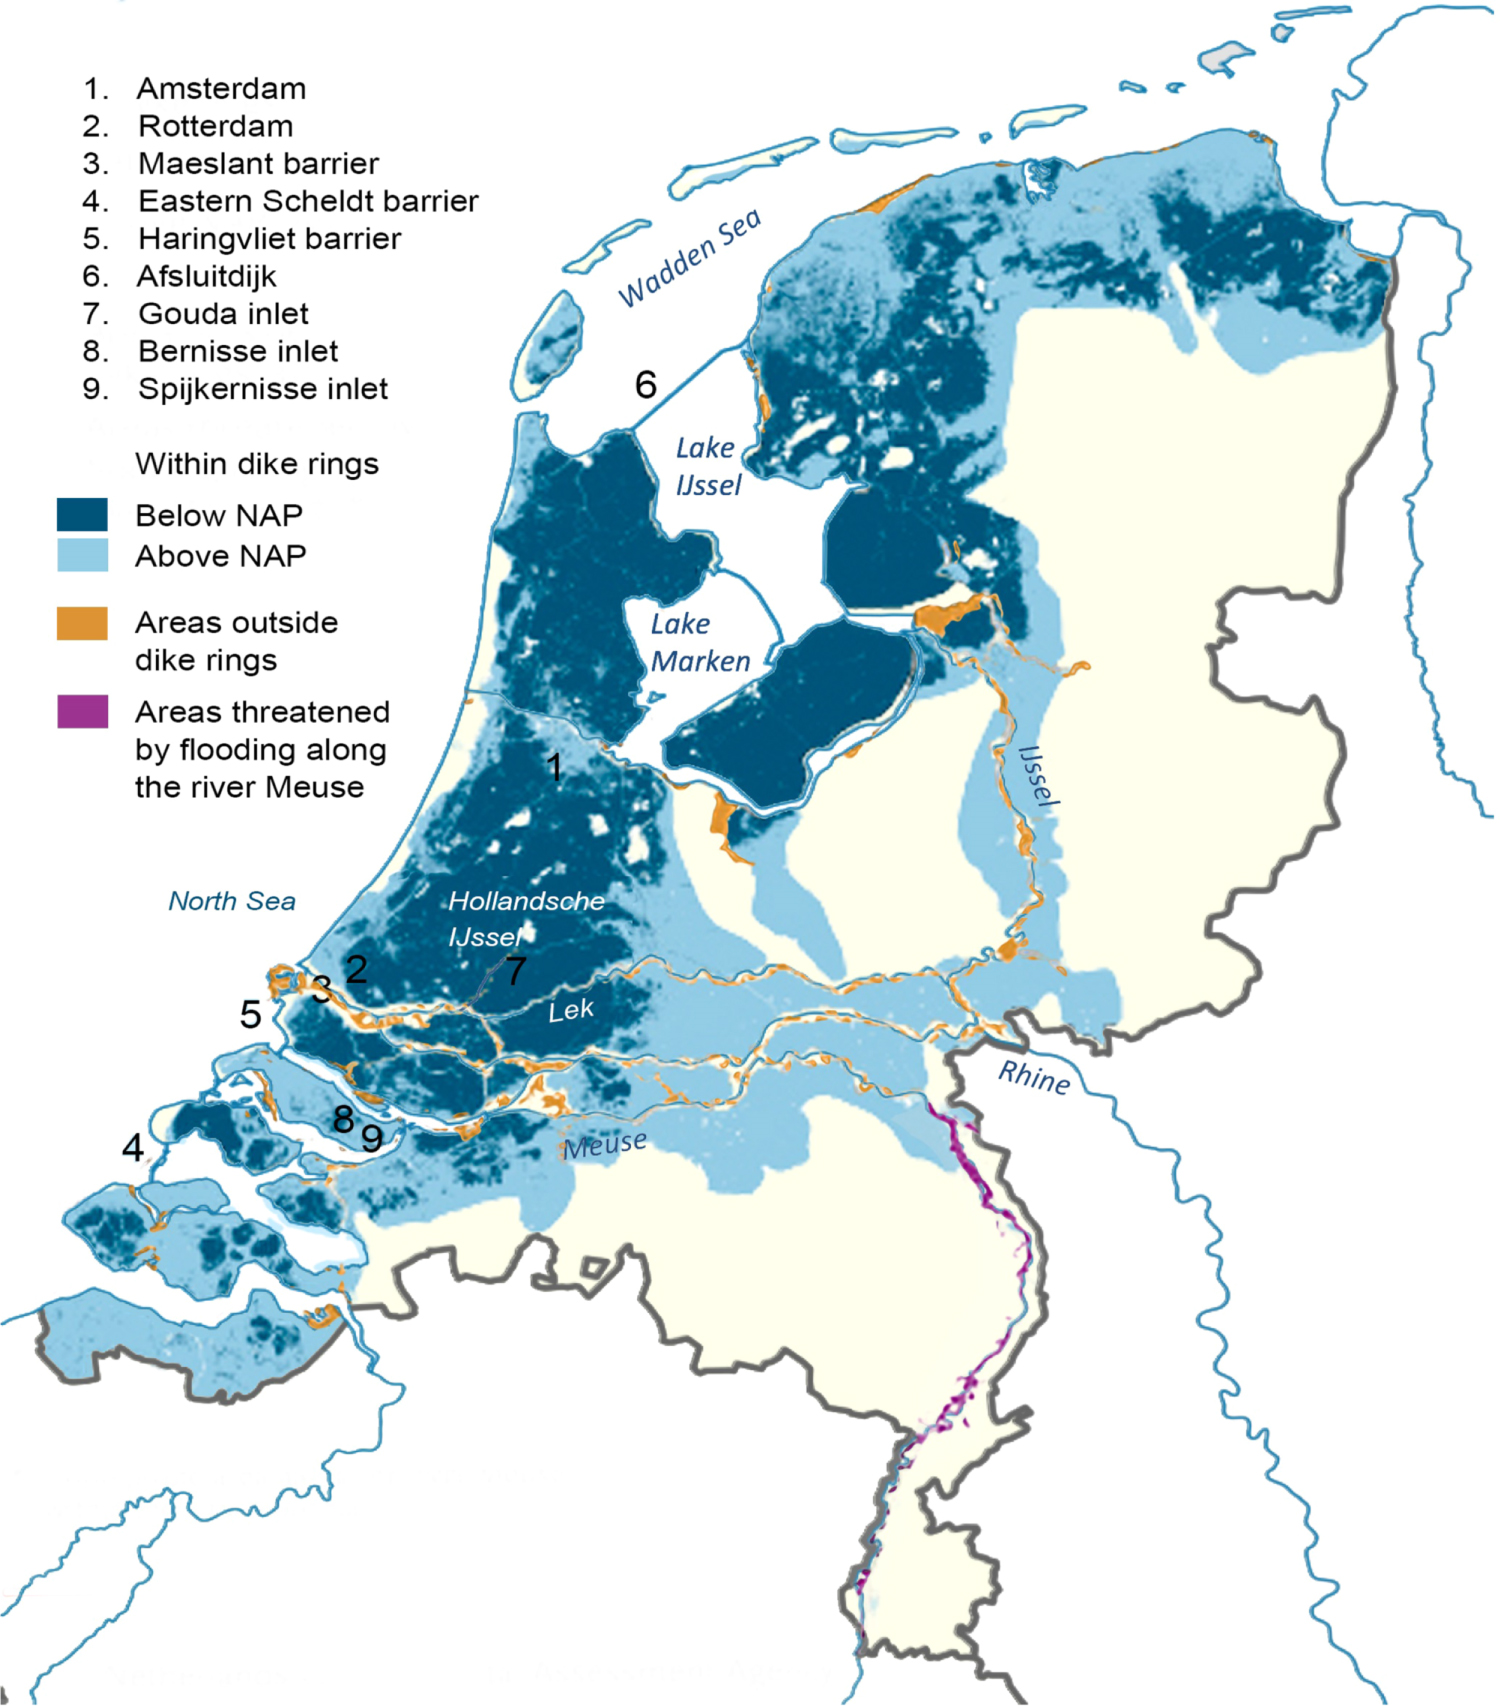
The Netherlands is situated in the low-lying Rhine-Meuse delta along the North Sea coast. The country is home to ∼17 million inhabitants and has a gross annual domestic product of about 800 billion Euros [57]. Nearly 60% of the country's area is susceptible to large scale coastal and river flooding, of which 26% is below present mean sea level (figure 1), making flood risk management and adaptation to SLR essential for its existence [22].

Figure 1. Map of the Netherlands showing flood prone zones (blue shadings) and features of the water management system (adapted from PBL [58]). N.A.P. is the Amsterdam Ordnance Level which is the reference plane for sea level height in the Netherlands.
Download figure:
Standard image High-resolution imageIn 2007, the government established the 2nd Delta Committee7 to advise on the future management of the Dutch coastal area. The Committee used a high-end SLR scenario [59] of 1.3 m in 2100 to ensure that new strategies are robust to high values of SLR [36]. The Committee concluded that SLR and climate change may be a serious threat for the Netherlands and advised to start the necessary preparations quickly, since implementation may take several decades [60]. The advice resulted in the Dutch Delta Program launched in 2010. Instead of using a worst-case scenario like the Delta Committee did, the current Delta Program uses a plausible range [22] and adopts the adaptive planning approach. Initially, an upper value of 0.85 m was chosen for 2100 based on the fourth assessment of the IPCC [61], which was later increased to 1 m based on the fifth assessment of the IPCC [24].
The Delta Program builds upon the sophisticated water management system in place [19, 20]. To protect the coastal area from flooding, the adaptive plan includes measures to maintain the sandy coast through sand nourishment and to adapt the annual volume of sand to the actual rate of SLR. Storm surge barriers will be improved and on the long-term replaced with the intention to keep the river mouths open. Along the rivers, a combination of raising dikes and increasing the discharge capacity by providing more room for the river should lower flood risk, with on the long-term the option to change the discharge distribution between the northern and western branches of the river. Fresh water supply for the Western part of the Netherlands will be improved by increasing the capacity of upstream river supply routes, in response to increased salt water intrusion from the sea. In the Lake IJssel, an increasingly larger storage will be established for fresh water supply, and more pumps will be installed to drain water to the Wadden Sea.
3. Materials and methods
3.1. SLR scenarios
In this study, we use global SLR projections provided by Le Bars et al [62] presenting probabilistic (but conditional on emissions) high-end SLR scenarios for the Netherlands assuming rapid ice sheet mass loss (figure 2). We use them as possible 'what-if'-scenarios. Le Bars et al included contributions from thermal expansion, Greenland and Antarctic ice sheets, glaciers and ice caps, and land water storage, similar to Church et al [27] but assuming DeConto and Pollard [29] projections for Antarctica, where hydro-fracturing and ice cliff failure lead to a rapid destabilization of the ice sheet. The sea level contributions are modulated by their spatial fingerprints representing gravitational, rotational and the short-term (elastic) earth response to mass loading changes [63]. The regional redistribution of ocean water due to changes in winds, ocean currents and local steric effects from the CMIP5 models [27, 64, 65] are taken into account to translate the global mean SLR to regional SLR along the Dutch coast. A Monte Carlo method is used to propagate the uncertainty between individual sea level contributors and the total sea level [66]. The correlation between contributors is modeled through their dependence on global mean surface temperature [67].
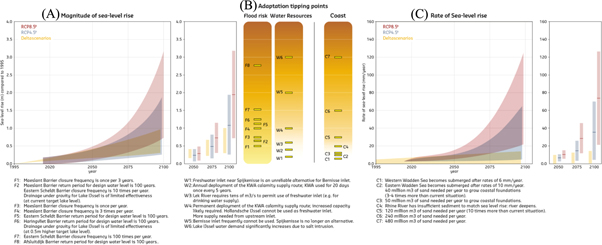
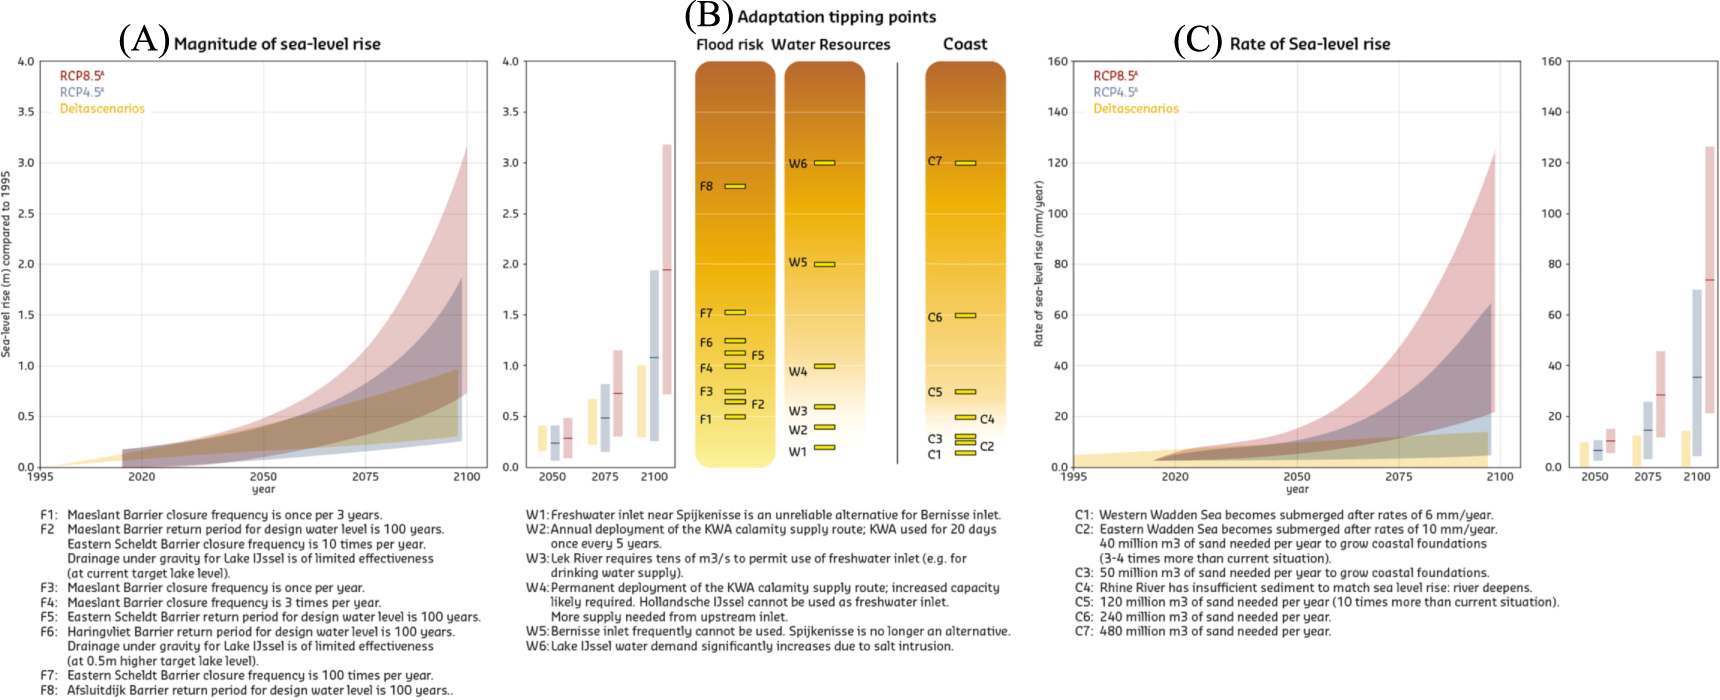
Figure 2. Adaptation tipping points in the Netherlands (B). For flood risk and fresh water resources this is related to the magnitude of sea-level rise in the Netherlands (A). For the maintenance of the coastline it is related to the rate of sea-level rise (C). The Deltascenarios are currently used in the current adaptive plan of the Delta Program. The projections with accelerated sea-level rise according to RCP4.5 (blue) and RCP8.5 (red) are based on Le Bars et al (2017) and indicated with RCP4.5A and RCP8.5A respectively. The bandwidth presents the 5th–95th percentile. For example: 'F7 Eastern Scheldt Barrier closing frequency is 100 times per year' takes place around SLR = 1.5 m. This occurs after 2100 in the Deltascenarios and at earliest around 2080 and 2090 according to the 95th percentiles for RCP8.5A and RCP4.5A respectively. After 2100 the sea level will rise further, and more adaptation tipping points would occur. Locations are presented in figure 1.
Download figure:
Standard image High-resolution imageUntil 2050, the resulting high-end SLR projections (referred to as RCP4.5A and RCP8.5A) are very similar to the current scenarios used in the Delta Program that are based on the IPCC fifth assessment (figure 2, Deltascenarios). However, after 2050, they start to deviate sharply, resulting in a much larger range of possible sea level futures. The 2050 time horizon corresponds with the timing of the Antarctic ice sheet instability in models used by Nauels et al [51] and Wong et al [38]. Differences compared to the Deltascenarios are mainly caused by contributions from Antarctica, and to a lesser extent to widening the considered uncertainty range (66% range by the IPCC and the Deltascenarios; 90% range in the projections with accelerated SLR). Under the RCP4.5A scenario, leading to a temperature rise of 1.7 °C–3.2 °C above pre-industrial values in 2081–2100, SLR may be as high as 2 m in 2100 (median value 1.10 m). Under the high-emission scenario RCP8.5A, leading to an increase of global mean temperature of 3.2 °C–5.4 °C, sea level could rise up to 3 m in 2100 (median value 1.95 m).
3.2. Impact assessment
Following the adaptation tipping point [68] approach, we quantify the magnitude or rate of SLR at which relevant impacts may occur for decision making. This allows for an analysis that can easily be adapted to scenario updates, as only the timing of the tipping points will change. The SLR scenarios are used to assess when in time they may occur. To explore implications for the Netherlands, we analyze impacts for the three main pillars of the Delta Program plan [20]: coastline, flood risk and fresh water resources management.
The sandy coast of the Netherlands is maintained by applying sand nourishment. We estimated required sand nourishment volumes based on the area of the marine coastal zone (∼4000 km2) and the rates of SLR. Impacts of SLR on the intertidal surface area of the Wadden Sea are estimated using the ASMITA model [69], which simulates sediment exchange between the North Sea coastal zone and the Wadden Sea. For each tidal inlet and related basin, critical SLR rates are calculated at which the maximum imported sediment volume is no longer sufficient to match SLR. At this point, the intertidal flats will start to diminish in surface area and/or height.
Storm surge barriers are key elements to flood risk management in the Netherlands. We quantified the impacts of SLR on (a) the closure frequency as a proxy for impacts on safety, ecology and navigation; and (b) the exceedance frequencies of design water levels as a proxy for the failure of the barrier [70]. For this, we use sea water level statistics derived from observations and a physical relation between these sea water levels and water levels at the locations that are relevant for the closure derived with the 2D-hydrodynamic model WAQUA [71]. Storm frequencies and characteristics may be affected by climate change which can affect storm surge levels (e.g. [72, 73]), and there is also deep uncertainty about extreme sea levels induced by storms and tides [74]. However, current projections of future changes in wind characteristics and impacts on extreme sea levels for the North Sea region are typically small and within the range of internal variability [75–78]. A sensitivity analysis was carried out to analyze the effect of change in storm surge under climate change projections in addition to SLR (supplementary material 1 is available online at stacks.iop.org/ERL/15/034007/mmedia).
Fresh water availability and demand is influenced by salinization through groundwater and surface water. Exfiltrating saline groundwater in the Dutch coastal zone is diluted with diverted riverine water to allow fresh water-dependent agriculture in these areas [79]. We estimated the fresh water demand for flushing by calculating saline groundwater exfiltration using a 3D variable-density groundwater flow model for the province of South Holland [80]. This assessment included the slow response of the groundwater system to SLR. Results were input for water and salt balance calculations with the Netherlands National Water Model [81] to calculate the total water demand. To estimate fresh water demand from the north, we combined the model output with a literature survey on subsurface characteristics, saline groundwater exfiltration rates, and freshwater flushing characteristics per polder [70]. Impacts on fresh water inlets along the Rhine estuary were obtained by calculating salt intrusion at different sea levels (0, 2 and 4 m) with a 3D hydraulic model assuming average flow conditions for the summer period in the river branches [82].
4. Results
The impacts of accelerated SLR on the coastal adaptation strategy of the Netherlands are summarized in figure 2, showing the magnitude and rate of SLR at which relevant impacts may occur for decision making in a 'burning-ember'-diagram [83] similarly to IPCC visualizations of climate change impacts. The SLR scenarios on the left and right can be used to assess when adaptation tipping points may occur.
4.1. Coastline management
As SLR accelerates, nourishments need to increase in volume or frequency to combat erosion and maintain the sandy coast. Presently, local observed SLR is ∼2 mm yr−1 [84], and approximately 12 million m3 of sand is applied annually along the Dutch coast [85]. We calculated that a 3–4 times larger volume is needed when the rate of SLR is 10 mm yr−1 (figure 2, panel B indicated with C2). Such a rate may occur from 2050 onwards under high warming levels combined with accelerated mass-loss of Antarctica (RCP8.5A) and from 2065 onwards under lower warming rates (RCP4.5A; median values; figure 2, panel C). Also, in high warming scenarios without accelerated Antarctic collapse (the upper range of the Deltascenarios in figure 2, Panel C) SLR rates exceed 10 mm yr−1 around 2050. Five times more sand would be needed at 14 mm yr−1, and 20 times more at a rate of 60 mm yr−1 (figure 2, Panel B). The latter may occur by the end of the century at high warming levels (RCP8.5A; median value). By then, the coast may need to be continuously nourished, which affects inhabitants and tourists that use the beach for recreation, and nature that needs time to recover from nourishment activities. These adverse impacts could possibly be avoided with a mega-nourishment strategy as applied in the experimental 'sand engine' approach (21.5 million m3) [85]. However, the estimated volumes are large; e.g. to keep up with 60 mm yr−1, the amount of sand needed would be equivalent to 12 'sand engines' per year. It is unknown whether the natural distribution of sand through ocean and tide currents along the coastline will be (fast) enough to ensure enough protection. Also, the bottom of the North Sea may have insufficient producible volumes of sand for nourishment and socio-economic developments may compete for sand as a resource (e.g. for building infrastructure [86, 87]). This suggests that a different governance may be needed to accommodate the scale and frequency of the required nourishment (e.g. to monitor and apply the sand and the procurement to nourishment firms).
Part of the supplied sand will be transported to the Wadden Sea, an UNESCO heritage site and the largest system of intertidal sand and mud flats in the world. However, the sediment transport capacity into the Wadden Sea is limited [69]. Hence, high rates of SLR will eventually lead to drowning of the system by a reduction in flat surface area and/or height [69]. For the Dutch Wadden Sea, the critical rate at which the intertidal flats will start to 'drown' is between 6 and 10 mm yr−1 [88]. These rates would be exceeded by 2030 and 2045 under the RCP8.5A scenario, and by 2050 and 2065 under RCP4.5A (median values). However, current observations of global [45, 89] and local SLR rates [84] are still much lower, and SLR would need to accelerate considerably to reach these critical rates before 2040. On the other hand, land subsidence could amplify local SLR rates, and subsidence rates (here due to gas and salt extraction [69]) will thus also influence at what moment in time the critical rates will be exceeded.
4.2. Flood risk management
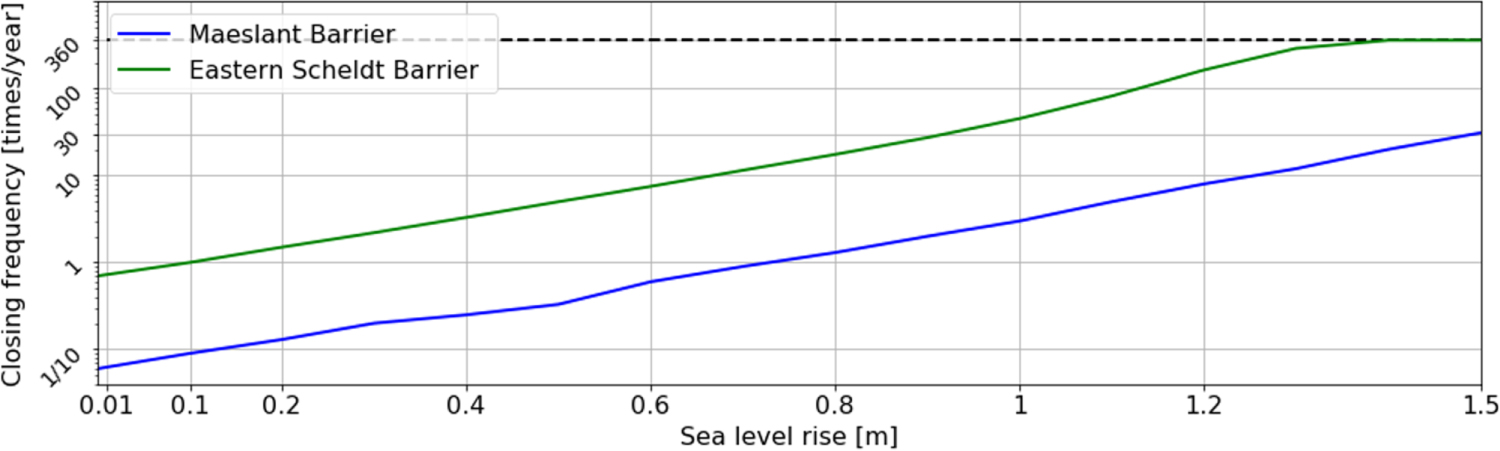
The Eastern Scheldt and the Maeslant storm surge barriers are key structures in the Dutch coastal defence system (figure 1). These barriers close during storm surge events but remain open for the rest of the time to preserve ecological values as well as for local fishery, and to allow navigation to large harbors. These functions will be compromised due to more frequent closing which increases failure probability and limits the connection to open sea. The Eastern Scheldt Barrier, designed to close on average once per year, would close 45 times per year at 1 m, and almost permanently at 1.3 m of SLR, if the current closure criteria were maintained (figure 3). The Maeslant Barrier that protects the city of Rotterdam will close 3 times per year at a rise of 1 m, whereas it currently closes approximately once every 15 years. At 1.5 m, this would increase to 30 times per year obstructing navigation to and from the Inner Port of Rotterdam during many weeks in the storm season. Closing also hampers the outflow of the Rhine River, which will increase flood risk along the rivers. Allowing higher water levels as closure criterion will delay this adaptation tipping point but needs to be complemented with raising the upstream river dikes to meet the flood standards and accepting more frequent flooding of unprotected areas. Under high rates of SLR, this option may only be useful for a very short time period. In the current plan, replacement of the Maeslant barrier by a combination of a closed dam and locks as well as replacement with a new storm surge barrier are considered options for the long-term. A decision for one of these options is required sooner in case of accelerated Antarctic mass-loss. For example, if the decision criterion for replacement would be 'not to close more than once per year', the decision shifts ∼15 years from at earliest around ∼2075 under the Deltascenarios to ∼2060 under the median value for RCP8.5A (see adaptation tipping point F3 in panel B of figure 2).

Figure 3. Closing frequency of the Maeslant Barrier and the Eastern Scheldt Barrier for different SLR levels, assuming present-day closure criteria.
Download figure:
Standard image High-resolution imageMost coastal flood defences should protect the country during extreme events occurring once in 1000–100 000 years. As sea levels rise the maximum water levels related to these extreme events—the design water levels—will increasingly be exceeded (figure 4). Our analysis shows that for the Maeslant Barrier the current design water levels are expected to be exceeded once every 10 years at 1.17 m of rise and at 2.12 m of rise for the Eastern Scheldt Barrier. The functional lifetime of the Barriers will thus be reduced considerably as flood safety standards are not met when design water levels are exceeded. The sensitivity to changes in storm surges due to changes in storm frequencies and characteristics is mostly up to a few years (supplementary material). Rising sea level will also require more pumping capacity to supplement the discharge of excess water that is currently mainly drained under gravity. Beyond 0.65 m of SLR, pumping is needed to structurally discharge all precipitation and river inflow from Lake IJssel to the Wadden Sea.
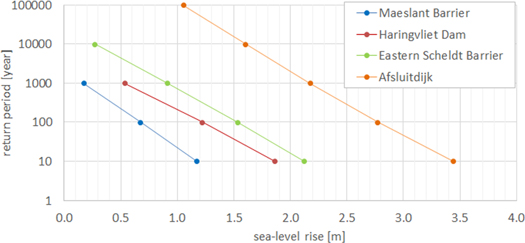
Figure 4. Return period of exceedance of the design water levels for the Maeslant Barrier, Haringvliet Dam, Eastern Scheldt Barrier and Afsluitdijk. Locations in figure 1.
Download figure:
Standard image High-resolution image4.3. Fresh water resources management
Fresh water availability and demand is increasingly affected as sea level rises. Saline water will enter deeper inland both by upward seepage from the groundwater and by inflow via the estuary (figures 5 and 6). Upward seepage will increase, resulting in higher soil moisture salinity along the low-lying areas of the coastal zone (10–20 km). This is the result of both the increasing pressure from the higher water levels at sea and in the rivers as well as autonomous developments due to historic land reclamation and soil subsidence [90]. Assuming current agricultural land use, fresh water demand for flushing of water courses to decrease salt concentrations is projected to increase significantly, possibly requiring a doubling of the planned water storage in Lake IJssel and Lake Marken by the end of the century.
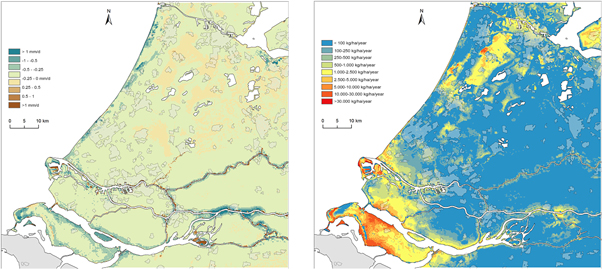
Figure 5. Change in upward seepage (mm yr−1; left) at the lower boundary of the Holocene deposits (−12.5 m NAP), and salt load (kg/ha/year; right) after a sea-level rise of 3 m in 2100 compared to current situation.
Download figure:
Standard image High-resolution image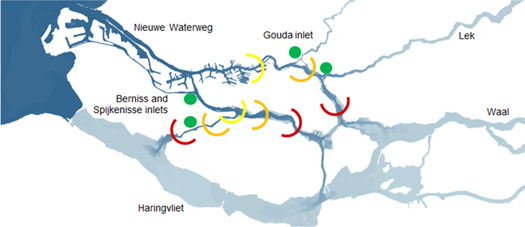
Figure 6. Location at which the simulated salt concentrations during high tides exceeds the threshold of 500 mg Cl l−1 for a sea water level of 0 m (yellow), 2 m (orange), and 4 m (red) and an average Rhine river inflow of 2200 m3 s−1. Green dots are water inlets for fresh water.
Download figure:
Standard image High-resolution imageFresh water inlets for the Rotterdam region will need to close more frequently and longer due to salt water intrusion. Currently, the Gouda inlet, serving 1100 km2 polder area with fresh water, closes occasionally during periods of low river flows and high storm surges. An alternative water supply route is then temporarily provided by diverting water from an upstream location along the river, the so-called KWA. Our results show that beyond 1 m SLR the Gouda inlet will be closed most of every summer half year (figure 6), and the alternative route would have to be in place permanently, possibly more upstream than currently considered in the adaptive plan, unless land use becomes more salt tolerant.
4.4. Implications for decision making
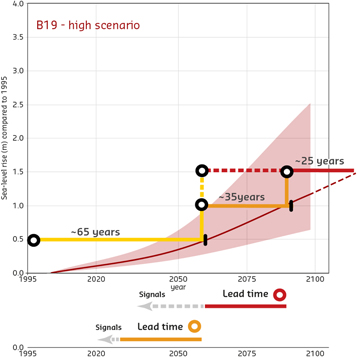
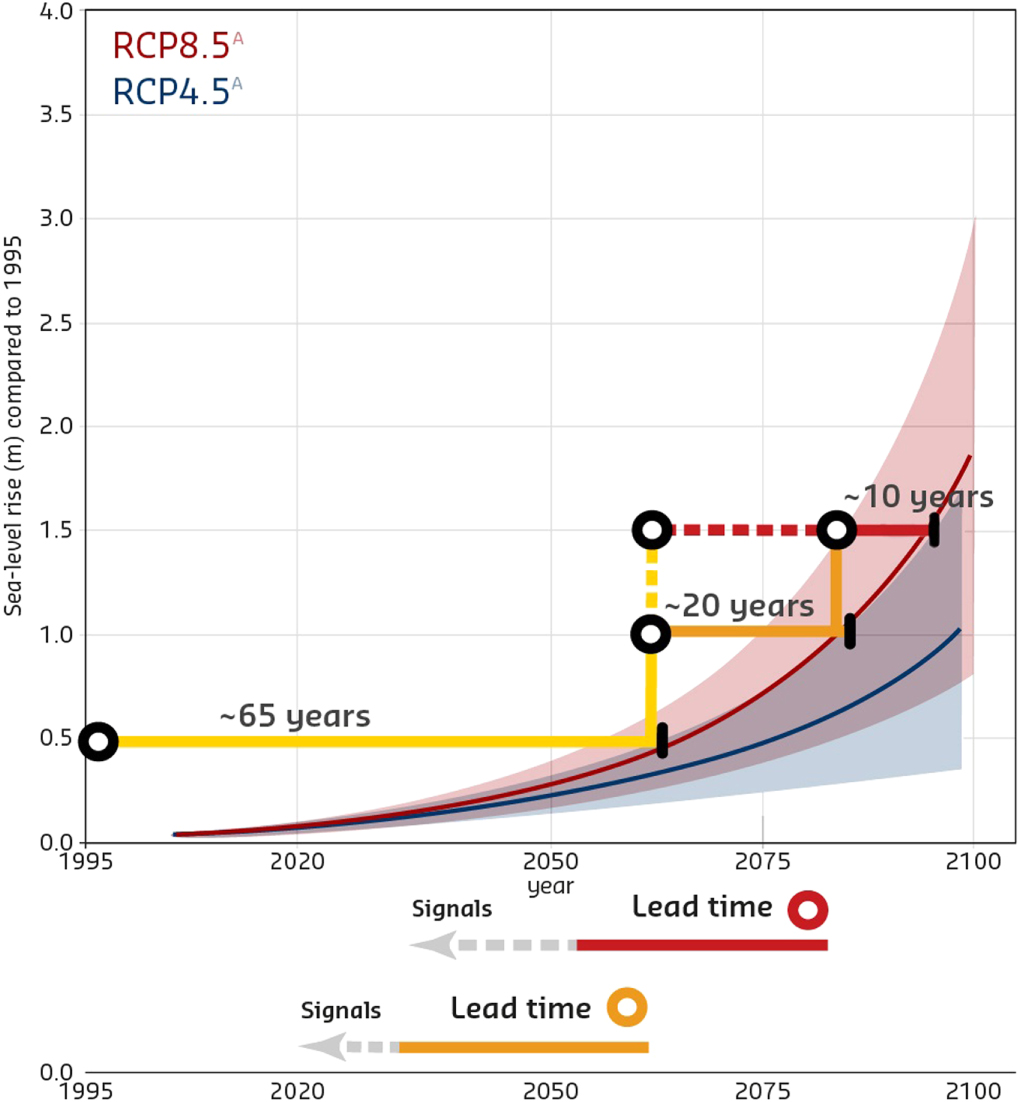
An increase in the uncertainty of future SLR including the possibility of a high and accelerated SLR has large consequences for decision making on coastal adaptation for low-lying coastal zones, particularly due to the potential increase in the rate of SLR and the timescales of adaptation. Timescales of adaptation involve (a) the envisioned functional lifetime of an intervention (e.g. the time period over which a decision continues to achieve the specified objectives) and (b) the available and required lead time to plan and implement measures (sometimes also more broadly defined as the time from first consideration to execution [91]). Table 1 gives an overview of generic coastal adaptation options and their functional lifetime and lead time. Figure 7 gives an example of an adaptation pathway existing of three adaptation decisions to 0.5 m of SLR, their functional lifetime (upper part) and the lead time of follow-up measures (lower part) for a global mean SLR similar to the median value of a high warming scenario (RCP8.5A) and the upper value of a low warming scenario (RCP4.5A). An alternative pathway starts with an adaptation to 0.5 m followed by a single decision to an additional 1 m of SLR (dashed lines). Note that, here, we have used the global mean SLR to discuss implications for low-lying coastal zones in the world.
Table 1. Timescales of different adaptation options on coastal adaptation to sea-level rise found worldwide. Lead time refers to the current lead time for planning and implementation time and the life time refers to the envisioned functional life time (adapted from [92]).
| Adaptation options | Lead time (year) | Functional lifetime (year) | Examples |
|---|---|---|---|
| (Storm surge) Barriers | 20–40 | 50–200 | - St Petersburg barrier: construction 1978–2011 (delay 1995–2005).- MOSE barrier (Venice, IT): 1966–1998-create support after '66 flood. Planned construction 2003–2022 - Eastern Scheldt barrier (NL). Implementation 1960–1986. Envisioned lifetime ∼200 years.- Thames Barrier was built between 1974–1984 and should protect London to high levels until 2030 after which the protection level would decrease but stay within acceptable limits |
| Dikes and dams | Tens of km per year | >50 | - Afsluitdijk (NL) proposed 1913, decision 1918, implementation 1927–1932.- Dike raising program (NL) raises 25 km yr−1, which should speed up to 50 km yr−1 in 2019 |
| Sand nourishment | Annually—every 5 years | 1–10 | - Annually nourishment along the sandy coast, revisited every 5 years (NL). Mega nourishment 'Sand-engine' implementation <1 year.- After series of cyclones removed sand from the beaches of the Gold coast (AUS), a study was executed during 1968–1971. Nourishment and artificial reef were implemented 1999–2003 |
| Pump | 2–10 | 20–50 | -Pump of 400 m3 s−1 in Afsluitdijk barrier (NL) planned 2017–2022.- Increase pump capacity 160–260 m3 s−1 at IJmuiden (NL), implementation took 2 years.- Mubarak pump station 300 m3 s−1 (Egypt). Implementation 1998–2003 |
| Land reclamation | 5–20 | >100 | - Palm island (Dubai). Implementation 2001–2006.- China reclaimed 133 km2 during 2003–2006.- Flevoland polder (NL), 2400 km2, reclamation period 1942–1968.- Extension of Port of Rotterdam (Maasvlakte 2, NL) with 120 km2. After several years of planning, implementation 2008–2013 |
| Flood-proofing building | 2–10 | 30–150 | - Houses have been built on mounts in the north around 500 BD to 1000 BD and still exist (NL).- After hurricane Katrina elevated houses were built within <10 years in New Orleans (USA). Historically elevated houses occur |
| Planned retreat | Years to decades, short after flood event | >100 | - Staten Island New York (USA) buy-out program accelerated after hurricane Sandy.- Kiribati purchased 20 km2 of land in Fiji |

Figure 7. Global mean sea-level rise including accelerated mass-loss from Antarctica for RCP4.5A (blue) and RCP8.5A (red) based on Le Bars et al [62] and the potential consequences for coastal adaptation. The bandwidth presents the 5th–95th percentile. The colored horizontal bars present an adaptation pathway existing of a sequence of measures for 0.5 m sea-level rise (from yellow to orange to red) and the functional lifetime of these adaptation measures in the event of an accelerating sea-level rise according to the median value for RCP8.5A or the 95th percentile for RCP4.5A. The lower panel shows a lead time of ∼30 years for planning and implementation, and required timing of signals and decision. An alternative pathway could start with the 'yellow' measure and switch directly to red (dashed lines).
Download figure:
Standard image High-resolution imageWe identify three major challenges arising from potentially accelerated SLR for coastal adaptation decision making. The first challenge is that decisions may need to be taken when there is still large uncertainty about the SLR at the end of the envisioned lifetime and the lead time of follow-up interventions. The time required for planning and implementation can typically add up to ∼30 years for large coastal defence projects [92] (table 1). For example, a replacement of the Maeslant barrier may be needed by ∼2060 under high warming levels and an accelerated mass-loss of Antarctica (RCP8.5A) as safety standards are not met anymore (due to increased closing frequency and the increased probability of exceeding design water levels). Assuming ∼30 years for planning and implementation, a decision would then be needed in the next 10 years. Although we may know more about the success of climate mitigation, future global warming and related SLR in the next decade, there may still be large uncertainty about SLR within the lifetime of such a structure, which is designed for a lifetime of 100–200 years.
Under potential accelerated SLR, with an increased uncertainty bandwidth, it may thus be difficult to take no- or low-regret decisions. Given the present timescales of adaptation (table 1), this may not only be the case for flood protection works, but also for planned retreat and land reclamation. Having flexible measures with a short lifetime and being able to speed up planning and implementation will thus be more important. Sand nourishment is an example of a flexible measure with a short lead- and lifetime [36]. However, it is important to explore the limits of this flexibility. At higher rates a step-change may be needed, and it is unknown whether this is possible considering the amounts of sands and rate at which it needs to be supplied. Similarly, additional pumps can be implemented to drain excess water from low-lying areas to the sea in a short time (2–10 years). However, when the barriers are permanently closed a step-change will occur as the runoff from the rivers Rhine and Meuse with an average combined flow of 2500 m3 s−1 will need to be pumped out. This requires a huge pump capacity, especially if gravity drainage through sluices is increasingly hampered due to additional sea level rise.
The second challenge is that the functional lifetime of existing or planned adaptation options reduces drastically and this has consequences for when and how (much) to adapt. For example, the lifetime of a measure designed for 0.5 m of SLR may reduce from 65 years to 10 years (figure 7). Such magnitudes of SLR were accounted for in the design of large coastal defence structures in the past (e.g. Thames Barrier or Delta works), but the envisioned lifetime was much longer (table 1). If adaptation measures continue to be implemented with similar SLR increments (up to ∼0.5 m of SLR), adaptation may need to accelerate significantly under extreme SLR. This requires governance structures that allow for rapid and radical decision making. Planning and implementation may even need to start before previous plans have been completed (in figure 7, lower part, preparations for 1.5 m may be needed before the 1 m measure is ready). Adaptation to higher increments of SLR (e.g. up to 2 or 3 m) will extend the functional lifetime considerably, which can be beneficial for measures with a long lifetime such as coastal defences, but will require reliable SLR signals as well as scenarios beyond 2100. Thus, adaptation to fast rising sea level either requires faster and more frequent measures with considerable flexibility, or needs to progress in much larger SLR increments than has been done in the past.
Thirdly, acceleration of adaptation can be hampered because of the social processes that precede and enable decisions [55]. Although we cannot know what will happen in the future and how societies would respond to accelerated SLR, we can expect learning and adaptation in institutions to cope with this growing threat, especially if the sense of urgency increases. However, the learning curve needs to be steep beyond 2050 since adequate adaptation will need many large impactful decisions parallel in time. Most coastal defence decisions have a long lifetime and cannot easily be solved with incremental or flexible measures, and these decisions will thus have to account for high amounts of sea level rise at once. As a result, large—potentially transformative—decisions with a long lead time may be required, making it difficult to accelerate adaptation. Our analysis shows that important adaptation tipping points will occur with accelerating sea levels and suggests that major follow-up measures may be needed at several places in a few decades, such as new flood defence barriers, large pumps to drain the rivers and more freshwater storage and additional supplies or adaptation of agriculture to saltier conditions. These are fundamental changes to the current water management system, and thus require time for planning and implementation.
5. Discussion
Few papers have studied consequences of multi-meter SLR for adaptation decision making. In the first decade of the 21st century, expert-based narratives for a response to 5 m of SLR by 2130 were explored in the Atlantis project for a few cases in Europe [55, 93–95]. For the Netherlands they conclude that technically it would be feasible to maintain the geographical integrity of the Netherlands, but that societal and political processes may be too slow to keep up with the rate of change [55]. An initial protection strategy would therefore be followed by retreat [95]. Similar to high-end SLR studies for the UK Thames Estuary, we find large consequences for the existing storm surge barriers and dams that may need to be replaced and complemented with pumps to drain the river [17, 56, 93]. This paper complements these studies by using the quantitative assessment to discuss the implications for decision making and implementation in terms of when, how much and how fast to adapt.
The SLR projections used in this paper illustrate a possible high and accelerated sea level rise. We are aware that other high-end SLR projections addressing uncertainties in Antarctic mass-loss have been published after we carried out our analysis (e.g. [53, 96]) and that new projections will likely become available in the years to come. To address the sensitivity of the challenges mentioned in section 4.4, we illustrate the impacts on the functional lifetime using the projections of Bamber et al [53] (figure 8). This extends the lifetime for decisions after 2050 compared to the projections used in this paper to ∼35 and ∼25 years (instead of ∼20 and ∼10 years), making the adaptation challenge smaller but still substantial. It also shows the need to have scenarios beyond 2100. Locally the rates and impacts of SLR and will differ, and decision context is unique for each country. With a regionalization to local SLR the timing of the tipping points, identified in this study, can be reassessed for new SLR projections.
Figure 8. Global mean sea-level rise including accelerated mass-loss from Antarctica for the high scenario according to Bamber et al [53] and potential consequences for adaptation decision making illustrated with two adaptation pathways for the median values as in figure 7. The bandwidth presents the 5th–95th percentile. The dashed line of the SLR projection is an extrapolation of the median values.
Download figure:
Standard image High-resolution image
Regarding the adaptive pathways approach, lessons can be drawn from this study. Initially, the idea of this approach was that for high-end SLR projections only the timing of the tipping points would change and not the adaptive plan [9]. This was also indicated in the Thames 2100 study by Penning-Rowsell et al [97]; 'both sensitivity and scenario analysis have little effect on option choice'. Our study shows that in the Netherlands SLR projections do have an impact on how to adapt; because of the rate of change, the lifetime will be so short, that some of the adaptation options are preferably bypassed (as e.g. discussed for the Maeslant barrier in section 4.2). It shows that the notion of an adaptive approach should be incorporated both in the plan itself through flexible measures and preparatory actions to keep options open (e.g. spatial reservations for future options), and in the design of structures to enable long-term adaptation (e.g. a large foundation of a structure to build higher later).
The time horizon of a pathways study should be chosen by considering the envisioned functional lifetime, the conditions and timing of limits and thresholds to adaptation and the lead time for follow-up measures. Consequently, for decisions with a long lifetime (>100 years), SLR scenarios beyond 2100 are needed (e.g. scenarios on SLR commitments [33, 98] and recent projections in the IPCC SROCC report [28]). These scenarios may show that for some decisions it is not a matter of whether SLR will rise to certain levels, but when this will occur. This may help to overcome decision paralysis due to uncertainty.
6. Conclusions
The Netherlands has adopted an adaptive plan that allows for adaptation over time depending on how the future unfolds. Recent SLR observations and projections have raised concerns about the plausibility of an uncertain strong acceleration of SLR after 2050 due to rapid mass-loss of the Antarctic ice sheet, which is not accounted for in the current adaptive plan. Rapid acceleration of SLR will significantly reduce the lifetime of adaptation measures and leaving less time to adapt, not only for the Netherlands but also for other low-lying coastal zones. Even for a well-protected developed country such as the Netherlands, the projected rate of change and increased uncertainty bandwidth has large implications, and may push current strategies to their limits or beyond. Sand nourishment volumes to maintain the coast would become 20 times larger than to date under rates of 60 mm yr−1 around the end of this century, storm surge barriers will need to close at increasing frequency until closed permanently, and intensified saltwater intrusion will reduce freshwater availability, under a rising demand. Until ∼2050 the present strategy is adequate and there is enough time to adapt. Our results show that after ∼2050 accelerated SLR may push the present strategy based on incremental no-regret measures to its limits. The uncertain rapid SLR has the potential to become a true gamechanger, as either incremental adaptation at an incredible pace is needed or transformative decisions to high magnitudes of SLR need to be taken under deep uncertainty.
Monitoring and detecting early warning signals for rapid SLR is essential in the coming decades. Time of emergence of SLR signals under different scenarios (e.g. [99]) needs to be further explored to assess the value of monitoring for crucial decisions such as coastal defence measures [21]. Monitoring needs to be timely, reliable and convincing to adapt and should therefore combine multiple signposts such as observations and projections from Antarctica, global mean sea level, and (responses to) impacts in vulnerable areas [21]. Despite deep uncertainty about future SLR, the high-end SLR scenarios can be used to assess under what conditions alternative adaptation pathways are needed, which can help to prepare and enable timely adaptation. Preparatory actions could include reserving space, carry out pilots and experiments to develop measures for high SLR and seizing opportunities arising from near term investments such as maintenance of structures and population growth. Waiting until uncertainties are resolved may result in regret of investments and undesired 'lock-ins' and may leave the Netherlands and other low-lying coastal regions with too little time to adapt. Our results confirm the value of high-end scenarios as put forward by Hinkel et al [8, 54], but also urge assessment of impacts beyond 2100, especially for areas in the world that are potentially heavily affected by these scenarios and for risk averse decision contexts. An integrated assessment of limits and thresholds to adaptation, as presented in this paper with the adaptation tipping points analysis [14, 100], may illuminate that multiple tipping points and thus the identified challenges and decisions may occur in a short time period. Large resources may be needed shortly, not only in terms of financial resources but also capacity of experts and decision makers. Our results also underline the importance of staying below 2 °C of global warming to reduce the risk of large SLR acceleration and to increase the ability to adapt and keep low-lying coasts and deltas inhabitable.
Acknowledgments
The authors thank the study's advisory board. Thanks to professor B Jonkman, professor J Aerts, professor E van Beek and professor H Middelkoop for reviewing the study, and to S Muis and R de Winter for reviewing the manuscript.
Data availability
The code for sea level projections is available on GitHub: https://github.com/dlebars/PSLP.
The remaining data that support the findings of this study are available from the corresponding author upon reasonable request.
Footnotes
- 7
The 1st Delta Committee was established in 1953 after the storm surge and extensive flooding of the southwestern Netherlands in which over 1800 people were killed. This 1st Delta Committee advised on the measures to improve the flood protection of this area, predominantly by shortening of the coastline by a comprehensive system of sluices, dams and a storm surge barrier, the so called 'Delta works'.