
How to measure groundwater yourself
What is the groundwater level on your land? Groundwater levels that are too high or too low can cause damage. Using the instructions below, you can measure the groundwater level yourself and discover how this level changes due to factors like rain, drought or building work in your area.

What is groundwater?
Groundwater is usually infiltrated rainwater that has drained into the subsurface. The groundwater level – the water table – is located where saturation occurs (where there is only water, and no air, between the sediment grains). The water below that is called the groundwater. Groundwater can also be replenished from ditches, canals, lakes and rivers.
The groundwater level is determined by:
- the infiltration of rainwater or surface water, and by evaporation
- the permeability of the soil and subsurface
- the distance to the surface water (ditches, canals)
- possibly by rising groundwater (seepage)
- the extraction or infiltration of water
Start measuring groundwater yourself
Below we explain in 6 steps how you can measure the groundwater in your area yourself.
Step 1: Find a representative location
Choose a location that is as far as possible from a ditch, trench or drainage pipe in an area where land use does not vary a lot, such as a park, meadow or garden. You should also make sure not to measure below or near a tree or large shrub. Keep as far as possible away from buildings unless you actually want to know the groundwater level near your house. You can also install a groundwater monitoring station under a paved surface by removing a tile, for example in a school playground. If the location is not in your own garden, make sure you have permission from the land owner.

Step 2: Material required
To monitor groundwater, you need:
- A PVC pipe with a diameter of 2 cm and a length of at least 2 m. If the groundwater level is lower, an extension of 1-2 m can be used.
- Two sealing caps for the PVC pipe: one cap to seal off the bottom of the tube permanently and one to close off the top (not permanently)
- Coarse sand to put around the filter and the protection block
- A protection block (such as a hollow concrete block measuring 20x20x20 cm) to protect the top of your monitoring pipe
- A stone to cover the protection block in order to protect your monitoring pipe
- A sturdy nylon stocking more than 1 m long. The stocking should let water through, but not sand. It should be positioned around the filter to stop sediment flowing in.
- Tie wraps or tape to secure the stocking
- A plunger with a tape measure
- A white rubbish bag to put the soil from the boring on
- An auger (at least 2 metres long, extra extensions in sandy soils)
- A saw or a drill to make holes in the pipe.
Step 3: Making a groundwater monitoring pipe
Make a 100-cm-long groundwater filter starting at 10 cm from the bottom of the pipe by cutting narrow grooves measuring 1-2 mm (the width of a saw blade) on the left and right sides of the pipe or by drilling a lot of small holes (1-2 mm). There should be no grooves or holes in the bottom 10 cm of the pipe. This section is needed to allow dirt to settle in the monitoring pipe.
Now put the permanent cap on the bottom of the pipe and make sure it is securely fastened, if necessary with glue. It must not come loose. This is to stop sediment getting into the pipe from the bottom.
Now wrap the filter stocking around the PVC pipe at the height of all the grooves and secure it at the top with tape.
Make a small (1-2 mm) hole in the sealing cap for the top so that there is contact with the air but rain is kept out, and put this cap on the top of the PVC pipe. Your groundwater monitoring pipe is ready to use.
Step 4: Installation of groundwater monitoring pipe
You should preferably install your groundwater monitoring pipe in the summer (August, September) because that is when the groundwater level is lowest.
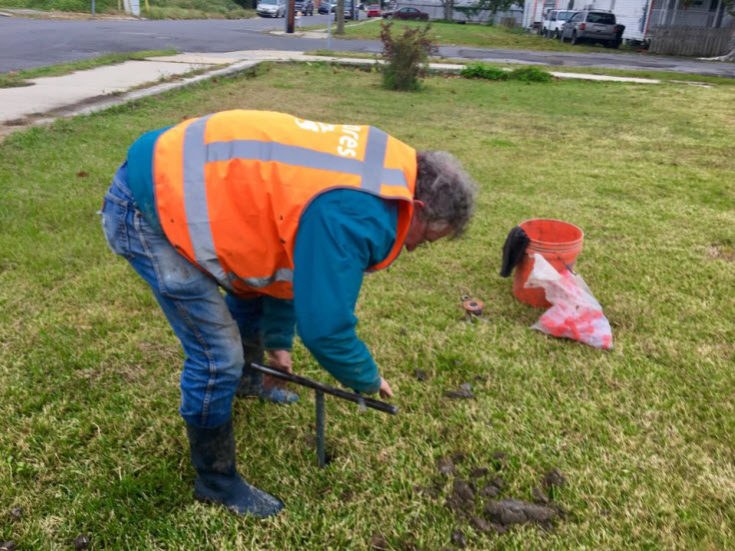
4.1 Bore
Using an auger, bore a hole to below the groundwater level: it should be at least 2 metres deep.
When the groundwater level is extremely low, you will have to bore deeper. If the subsoil consists of peat, clay and loamy sand, this will not present a problem. If your subsoil is made up of coarser sand, you will have to work hard. Make sure you put the soil from the bore hole neatly in sequence on the white plastic bag so that you can describe it later.
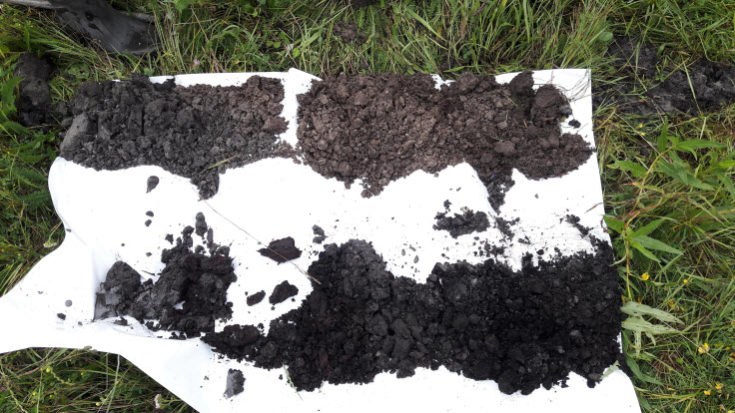
4.2 Describing your bore sample
Take your white rubbish bag and roll it out on the ground (enlarge the surface area if necessary by cutting it) to lay out the soil samples systematically – from top to bottom. Take a photograph of this bore sample and describe it when you have finished. The description should first state the depth of the main changes. These changes can be different in terms of the sediment – sand, clay, peat – but also in colour.
The presence of signs of rust immediately gives an idea of the groundwater fluctuation. This is the mean lowest groundwater level. One can often distinguish between three groups of rust zone:
- Starting at ground level, a zone without rust spots. This zone is above the mean highest groundwater level.
- A zone with rust spots. This is the zone between the mean highest and lowest groundwater levels.
- And below that, there will be another zone without rust spots because this zone is always in the groundwater and no air can get to it to form rust. This is the mean lowest groundwater level. This zone is often pale grey in the case of sand and clay. But it can also be light brown or a different colour. These boundaries are interesting for studying groundwater.
The soil samples can be stored in plastic bags and studied later to determine the grain size, type of sediment, etc.
4.3 Groundwater monitoring pipe
Take your groundwater monitoring pipe and push it with the filter sleeve at the bottom down to the end of your borehole. Do this as soon as possible after the last boring operation: the borehole can collapse.
Fill up the bottom metre carefully with the coarse sand. This sand acts as a filter layer. Use an iron or wooden rod to compact the sand. If the borehole is in sand only, the rest (at the top) can also be filled up with sand. If the borehole is also in peat or clay, the rest (at the top) must be filled up as much as possible with this clay to stop rainwater flowing in.
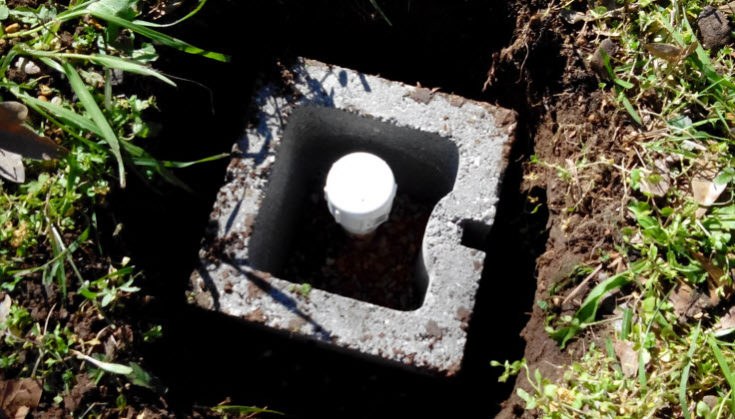
Using a shovel, dig out a square of approximately 10 cm below the ground level around the top of the monitoring pipe. Position the protection block around the PVC pipe and fill it up with coarse sand. Saw off the tube so that it is below the top of the protection block. Then put the covering stone on top.
Step 5: Monitoring
Groundwater levels are stated relative to ground level. For your monitoring, first note the height of the ‘top of the pipe’ with respect to the ground level.
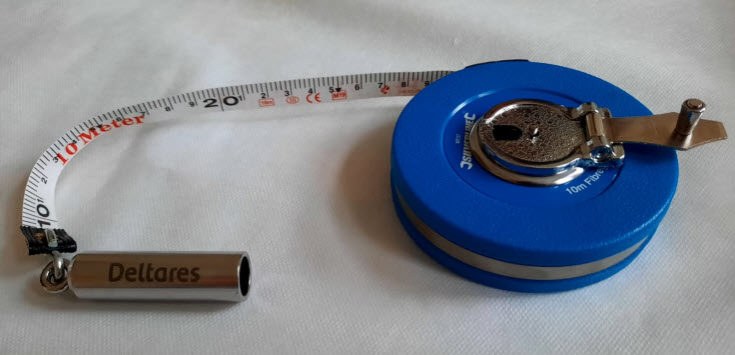
The easiest and cheapest way to measure groundwater levels is to use a plunger. This is a hollow tube that makes a ‘plop’ sound when it reaches the groundwater. It is suspended on a tape measure. A range of companies market plungers.
Lower your punger into the pipe to start measuring. You will know you have arrived approximately at the groundwater level when you hear the first ‘plop’. Move the plunger up and down around this water level. The closer you get to the groundwater level, the less movement there will be. Then read the tape measure relative to the top of the measuring pipe. Make a note of the reading. To determine the groundwater level relative to ground level, you correct your measurement with the difference between the top of the pipe and the ground level. If the pipe is higher than the ground level, subtract the number of millimetres or centimetres. If the pipe is lower than the ground level, add the number of millimetres or centimetres.
You can decide on your own monitoring frequency. The more regular, the better. We recommend a frequency of at least once every fortnight. The day does not matter and you can also change days.
You can also use sensors. These are more expensive at around € 500. The sensors can be suspended in the monitoring pipe and checked whenever is convenient. You need specific software to take readings with the sensors. If you use sensors, you can monitor the groundwater level on an hourly basis. These measurements provide more information about how the groundwater level responds to rain showers. Sensors can work for 5-10 years without changing the battery.
Step 6: Working up the monitoring data
You can, for example, enter your monitoring results in an Excel file and work them up into a graph showing time/groundwater level. The monitoring results can be referenced to ground level or to the National Reference Level (such as NAVD88 in the USA). When working up results in relation to ground level, the readings must be corrected for the height of the ‘top of the pipe’. The National Reference Level can be estimated using available data (DEM, digital elevation model).
Supplementing monitoring data with rainfall data
To work up the data in greater depth, the graph can be expanded to include rainfall and/or evapotranspiration data. You can collect these data yourself or use the nearest weather station.
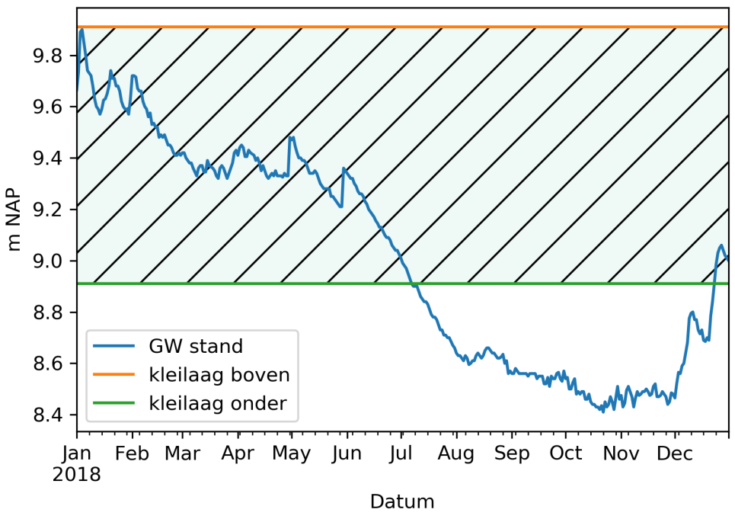
It can be useful or interesting to compare groundwater fluctuation with:
- The surface water level in the area. By how much is the groundwater level higher or lower?
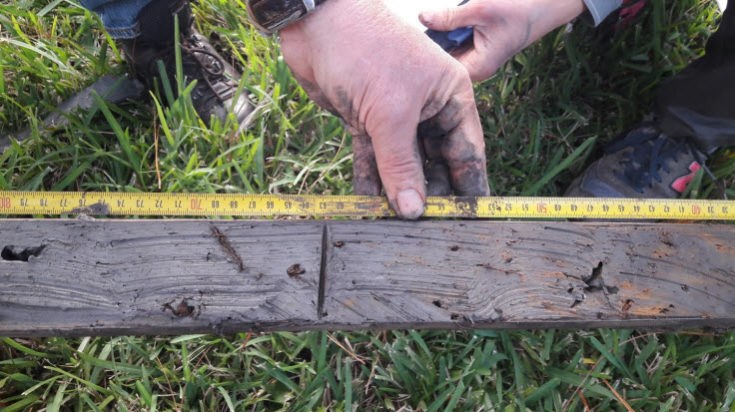
- The top of wooden pile foundations if they are present. Wooden foundations should always be under the groundwater level, otherwise the wood rots.
- The presence of peat or clay with organic material to estimate susceptibility to subsidence. When peat is left above the groundwater level, it is lost and the ground level drops.
These levels can then be included in the graph as horizontal lines.
Good luck! And enjoy monitoring your groundwater level and discovering the differences during the course of the seasons.


