
LiDAR data in coastal lowland/peatland landscape mapping and management
Deltares, with partners in several projects, is pioneering the use of large-scale but cost-effective LiDAR data collection in coastal lowlands, for spatial planning, management of peatlands, and modelling of flood risks.
What does Deltares do?
We are applying new methods in Indonesia that reduce LiDAR cost by up to tenfold (by not flying full coverage) while still yielding elevation models that are accurate enough (90% within 0.5 m) for the purpose of landscape scale assessments of flood risk, peat thickness and related parameters. Peat thickness mapping applying this data is most accurate in peat domes where peat thickness is over 3 metres; however for the lowest lying areas with shallow peat other ground-based methods will be required for peat mapping.
What is lowland?
Coastal lowland is the low lying land (and peatland) that is formed in deltas and along rivers along the coast. In Indonesia, lowland is generally less than 10 metres above Sea level and occurs less than 100 km from the Sea.
What is peatland?
Peat consists of 90% water and 10% organic material that is mostly carbon. After drainage, peat will decompose, and often burn, causing carbon emissions to the atmosphere, as well as land subsidence that results in flooding. Peatlands are therefore not really ‘land’ in the normal sense, but should be managed as wetlands with high water levels and limited disturbance to keep the carbon stored and the surface above flood levels. This lesson has been ignored in many countries through history, often leading to land abandonment. At present, the problem is most urgent in SE Asia where ~20 million hectares of peatland are largely deforested, drained, and often burning.
Why are better data needed?
Better data is needed for better management. Elevation models can be used to produce peat thickness maps as well as flood risk models. Such maps are needed to determine what activities are possible on peatland and other lowland, as flood risk is often high and deep peat is known to be unsuitable for many uses. With better maps, better spatial planning and zoning is possible that minimizes carbon emissions, fire risk and flood risk.
This web page presents an outline of the Deltares approach to peatland mapping using LiDAR data. For more detail, please download our PowerPoint presentation.
From LiDAR DTM to peat thickness model
From LiDAR data, digital terrain models (DTMs) of the peat surface are created. This is combined with peat thickness data collected in field surveys to determine the position of the peat bottom (relative to Sea level), which we find to be within a 2 m range over some 90% of the area in most peat landscapes (this is explained by tropical coastal peat domes having evolved from flat mangroves and river floodplains). In many areas, it suffices for all practical intents and purposes to assume that the peat bottom is flat, allowing a simple uniform calculation of peat thickness from the DTM. Where necessary, the method can be further refined by using actual peat bottom positions to create a spatially variable peat bottom model.
Peat thickness mapping applying LiDAR data is most accurate in peat domes where peat thickness is over 2 or 3 metres (the precise limit is being investigated). For the lowest lying areas with shallower peat, we apply traditional survey methods using augers, that are far more time consuming and costly. However, by first determining the peat dome landscape, the area over which such intensive augering is needed can be reduced to 10-30% of the peat area.
Mapping peat extent
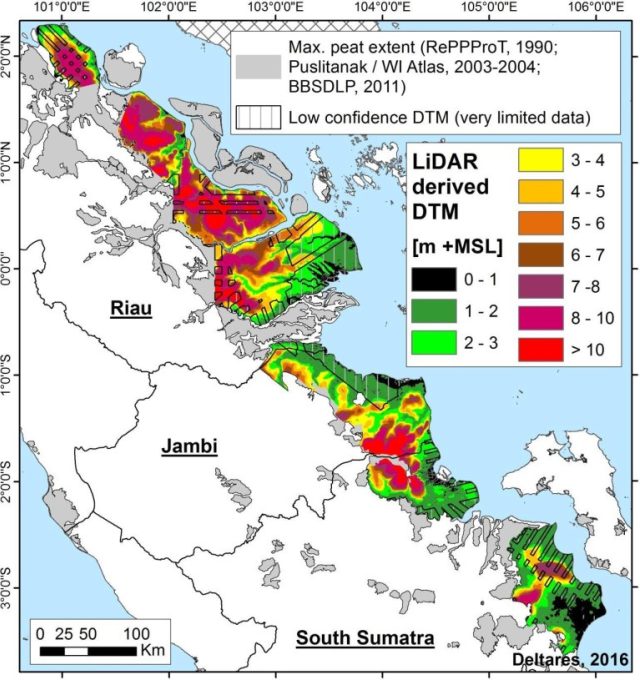
Peat extent is determined from a combination of visual RS source analysis (e.g. Landsat, Sentinel) and field augering surveys. In fact, peat extent is already fairly well known in most regions in Indonesia and especially in Sumatra (better than peat extent in most countries), certainly much better than peat thickness; in such areas existing maps only have to be refined. We use a combination of three existing maps (RePPPRoT, 1990; Puslitanak/WI, 2003/04; and BBSDLP, 2011) as a starting point to determine where peat extent is least certain.
Mapping water table depth
In areas where peatland is drained, canal water levels can be determined from LiDAR data (LiDAR picks up debris in the water, which we find to be abundant); Deltares is developing automated routines to do this. From canal water level, ground water depth can be calculated as a function of distance from canal. Where no canals exist, we may assume a natural water level for which we apply water budget models that use rainfall rates as generated by the national monitoring system that Deltares has developed with BMKG (the Indonesian Meteorological organization). This method has been well tested over the years.
Mapping canal blocking restoration requirements
From the position and dimension of canals as determined from LiDAR, as well as the derived water table depth (see above) it is possible to quantify canal blocking requirements to achieve rewetting and restoration, in terms of materials and budgets required. We believe this is the most urgent mapping requirement at present, given the need to soon restore Indonesia’s peatlands.
Mapping flood risk
From the DTM land surface levels and river/sea flood levels, we calculate flood risk in terms of depth, extent and recurrence interval. This can be done for current conditions and future scenarios, applying known land subsidence rates in drained peatlands. We believe that current and future flood risk in peatlands should be a key consideration when optimising land management plans. For example see: Flooding projections for oil palm plantations in the Rajang Delta peatlands, Sarawak, Malaysia
Mapping land cover
LiDAR data also allow precise analysis of canopy structure and thus the degree of degradation of remaining forest. The resulting maps can be used in decisions on land use planning, rewetting buffer zones etc.
Map accuracy
From analyses with a full-coverage DTM for the EMRP area in Central Kalimantan, we have found the accuracy of a DTM at 5 km strip spacing to be within 0.5 m for 90% of the area and within 1m for 98% of the area; this is far better than is possible with a ground survey based DTM in peatland, at a small fraction of the cost. We estimate this to be suitable for a map scale between 1:10,000 and 1:5,000.
The accuracy of the peat thickness map derived from the DTM is being assessed; this is complicated by the finding that many existing peat thickness datasets that we can use for verification are flawed, with peat thickness usually being underreported. Field surveys are ongoing to obtain sufficient data to assess the validity of existing datasets.
Data availability
A database of some 10,000 peat thickness measurements in Sumatra and Kalimantan covering nearly all peat landscapes has been developed in a sequence of projects over the last 5 years, which can be applied for the above purposes. In data scarce areas, or areas where peat thickness is probably less than 3 m, additional field surveys are implemented.
LiDAR data has already been collected over most (>80%) of peatland along the East Sumatra coastline (in the Provinces of Riau, Jambi and South Sumatra), at intervals of 5 to 10 km (this will be refined to 2.5 – 5 km by late 2016), allowing mapping at the landscape scale. This data is being brought into the public domain (upon request, to groups doing relevant research on these topics in SE Asia) and suffices for most intents and purposes. Where greater accuracy is required, additional LiDAR can be flown to fill gaps; this can be added to ongoing LiDAR data collection programmes which greatly reduces cost and increases speed.