
MSFD-Eutro: Interactive web-mapping
A demonstration of the Copernicus Marine Environment Monitoring Service (CMEMS) for Region European North-West Shelf Seas and Area of benefit Coastal and Marine Environment – Water quality.
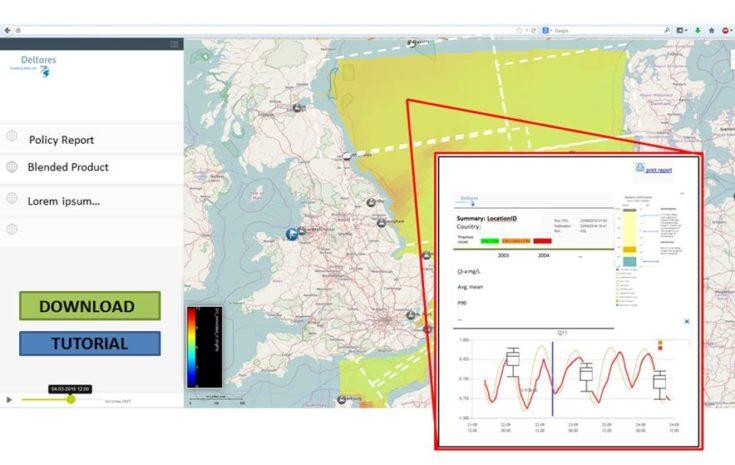
Interactive web-mapping chlorophyll indicator maps
MSFD-Eutro is a free and open, active and interactive web-mapping service that shows chlorophyll indicator maps based on growing-season statistics (mean, and max as P90). MSFD-Eutro aims to facilitate the use and appreciation of ocean colour data by policy advisors and policy makers for the European Marine Strategy Framework Directive (MSFD).
MSFD-Eutro focuses on the Region CMEMS European North West Shelf Seas, which is OSPAR Greater North Sea Region (Region II) and Area of Benefit Marine Environment[/caption]
MSFD-Eutro uses the following products from the Copernicus Marine Service:
Historical multi-year, 1 km resolution
• CMEMS OCEANCOLOUR_ATL_CHL_L3_REP_OBSERVATIONS_009_067
• CMEMS OCEANCOLOUR_ATL_OPTICS_L3_REP_OBSERVATIONS_009_066
Near-real time (delayed), 1 km resolution
• CMEMS OCEANCOLOUR_ATL_CHL_L3_NRT_OBSERVATIONS_009_036, or 050
• CMEMS OCEANCOLOUR_ATL_OPTICS_L3_NRT_OBSERVATIONS_009_034
We are applying operational weekly updates of underlying data, as well as occasional batch downloading. From the collected data we calculate yearly and six-yearly growing-season statistics, which are shown on our service. Our service has been operational since September 2018, and the service will be regularly maintained (at least quarterly), and updated (at least yearly) until 2020.
Variations and changes in the chlorophyll concentrations
Phytoplankton is an omnipresent aquatic primary life form. Increases in phytoplankton cell numbers can result from favourable environmental conditions, which can be either mixing or water column stratification, increase in light availability, water temperature and/or nutrient levels. Phytoplankton is also grazed and is at the base of the aquatic food web, providing an essential ecological function for all aquatic life. Variations and changes in the chlorophyll concentrations (CHL) are relevant for the study of the ecology and health of the sea.
The tiny phytoplankton cells colour the waters green, because these single-celled algae contain the chlorophyll pigment. The colour of the water can be measured by satellite sensors. We use the chlorophyll and optical data that were derived from electromagnetic radiances measured by these sensors. The Copernicus Marine Environment Monitoring Service (CMEMS) delivers data for further analyses. CMEMS CHL products are combined with standard satellite CHL products for turbid waters, and statistics (such as multi-year mean and maximum were calculated.
Trend analysis of CHL helps to understand the response of the marine ecosystem to human pressures such as eutrophication. The status of a particular marine area with respect to eutrophication is determined by winter nutrient concentrations, but also by multi-year mean and maximum (expressed as P90) chlorophyll-a concentrations evaluated against certain thresholds (assessment levels). Hence, our interactive web-mapping tool provides input to the discussion on international harmonisation of assessment levels and methods.
