ORCA
Our specialists have been working on a method to standardise the execution of metocean studies, by developing guidelines along with a MATLAB tool, called ORCA, which integrates the main aspects of analysing metocean data.
Go directly to
The design of marine structures, such as offshore structures, wind parks, coastal structures, etc, generally starts with a metocean study to determine the mean, operational and extreme environmental conditions that the structures will need to withstand.
Deltares frequently carries out metocean studies for a broad spectrum of clients such as project developers, governments, local businesses, contractors, oil and gas producers, etc.
ORCA aspects of data analysis
ORCA (met Ocean data tRansformation, Classification and Analysis) is a MATLAB Tool for analysis, classification and transformation of metocean data, developed by Deltares. Deltares frequently carries out metocean studies.
These studies involve quite a lot of statistical analyses, which for a large part are carried out using ORCA. At the moment, there are five functionalities available on the ORCA tool. Each one deals with a certain aspect of data analysis, namely:
- Data validation - Procedures necessary for the determination of a "good dataset". These include procedures for reading of different data, analysis of gaps in time series, data visualization, data comparison, error statistics and plots, and data correction.
- Normal conditions - Procedures necessary for the determination of mean climates. Consisting of, among others, procedures for data classification, creation of wave roses, data transformation and definition of mean climate scenarios.
- Extreme conditions - Procedures for extreme value analysis. Consisting of, among others, procedures for the collection of peak-over-threshold data, the collection of annual maxima data, definition of optimal threshold for the estimation of the generalized Pareto distribution parameters, return value estimation, fitting of statistical distributions.
- Sea State analysis - Procedures for sea state analysis. Consisting of, among others, procedures for fitting of different spectral forms to discrete spectral data, estimation of sea state wave statistics (e.g.: number of waves, H1%).
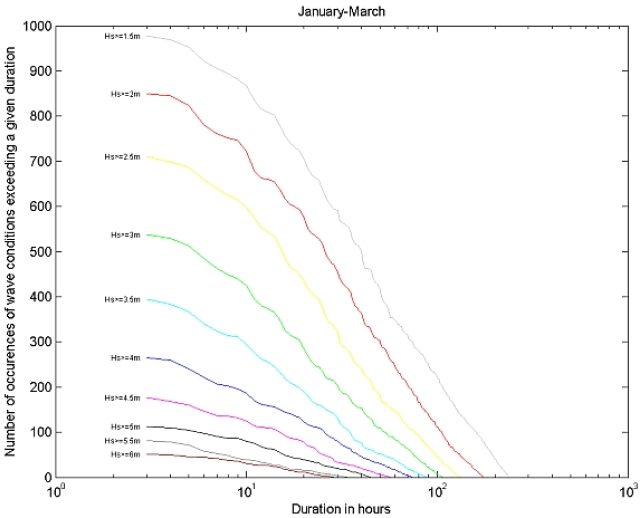
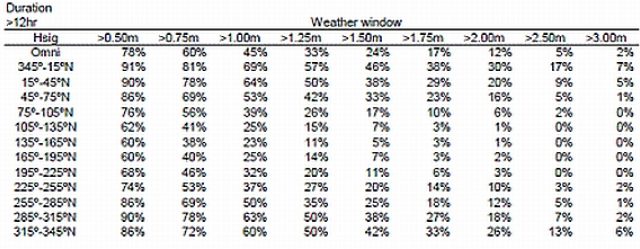
- Persistence statistics - Procedures for carrying out workability and accessibility analysis.
Graphical User Interface and toolbox
There is currently a GUI available with which the most important analyses available in the Data Validation, Normal Conditions and Extreme Conditions functionalities can be carried out. The remaining functionalities are available as MATLAB code and there are exemplary scripts and guidelines available on how to use them. When a client is only interested in the GUI then he requires no MATLAB since the GUI is available in a platform independent format.
Data validation
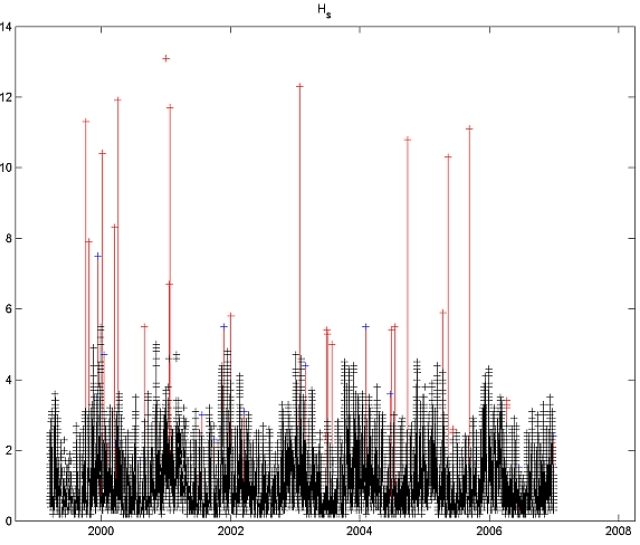
Each metocean study starts with a dataset of either measured or modelled quantities. The dataset is the basis of the study. It is therefore very important to know what the set looks like and what its qualities are. Are the measurements reliable? What is the source of the measurements? Has the measuring device been operational during the entire period covered by the dataset, or does the dataset show gaps in the measurements? Is the numerical model reliable? Have the numerical results been validated and calibrated?
ORCA’s first tool answers some of these questions. The Data Validation Tool can be used to inspect and improve datasets. It consists of three parts:
- A Data QA module that checks and adjusts the consistency of the dataset itself. This module can read datasets of various formats, visualize the quantities in the dataset (e.g. in plots of time series), identify and fill gaps in the data during the period covered by the dataset, remove outliers etc.
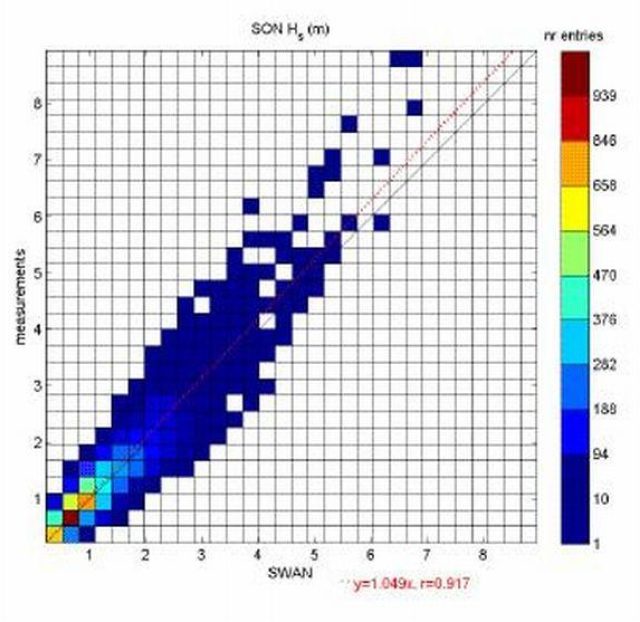
- A Data Comparison module that compares the data with data from another dataset (e.g. model data with buoy measurements) and corrects the data if necessary
- The Error statistics module that can be used for error analyses. Spatial error analyses being also included.
Normal conditions
With the Normal Conditions functionality of ORCA mean climates can be determined on the basis of time series of metocean variables. A mean climate can be determined and represented in a number of ways. For instance as standard bivariate distributions (joint occurrences of, for instance, wind speed and velocity within certain classes) or as multivariate and multidimensional mean conditions.
ORCA offers three possibilities to represent a climate:
- By means of roses;
- By means of joint occurrence tables,
- By means of multivariate means per multi-dimensional condition.
The first possibility is used to visualise the mean climate of a certain directional variable at one or more locations.
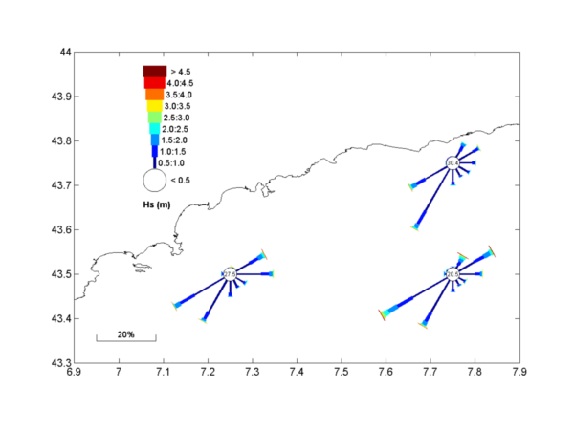
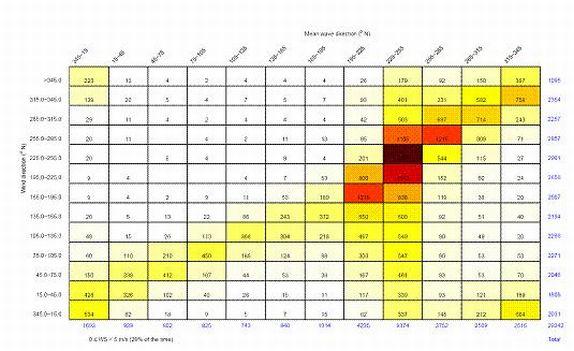
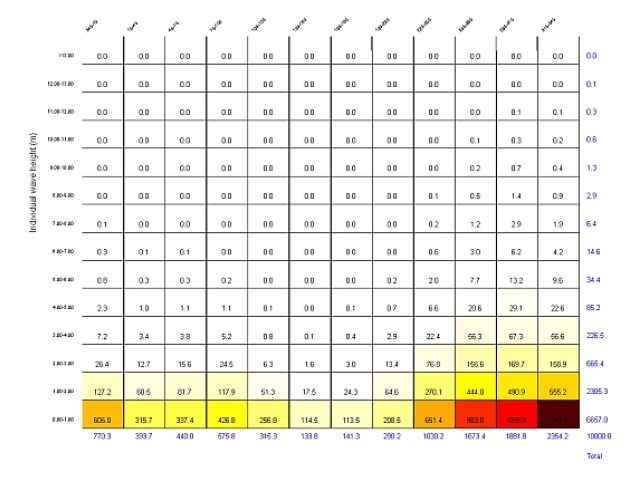
The second possibility is useful when the precise number of occurrences is needed, see figure below.
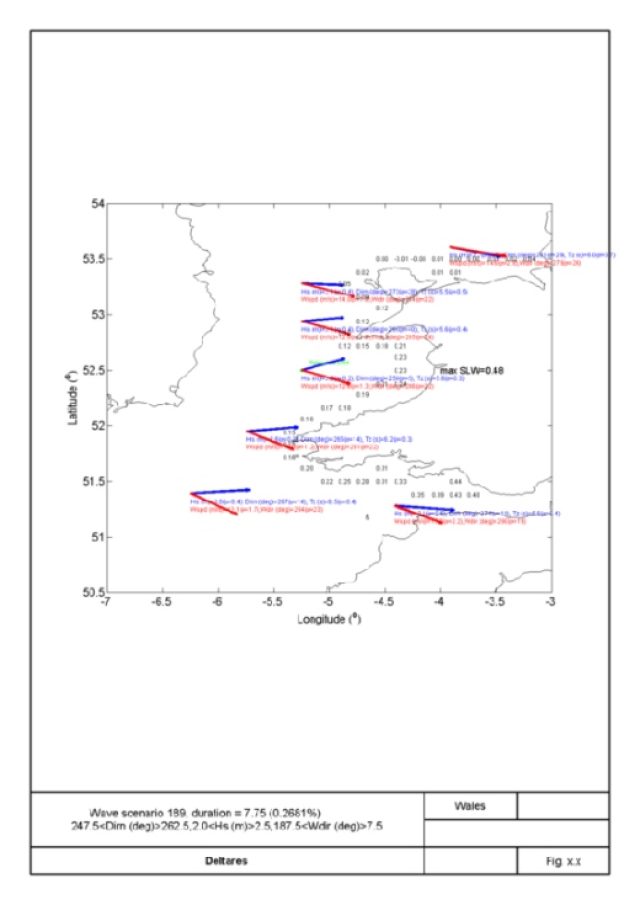
With the third possibility, the climate is represented as a (multivariate) number of mean conditions, each representing one (multi-dimensional) class. Such a set of mean conditions is called a “scenario”.
In the bi-dimensional and bivariate case a scenario could be the mean values of the significant wave height (H s) and mean wave direction (MWD) data falling in the bi-dimensional class 0.5m<H s<1.0m and 165°N<MWD<195°N, which could be H s = 0.9m and MWD = 183°N. Scenarios are, however, generally defined using several variables at a number of locations. An example of a scenario is given below.
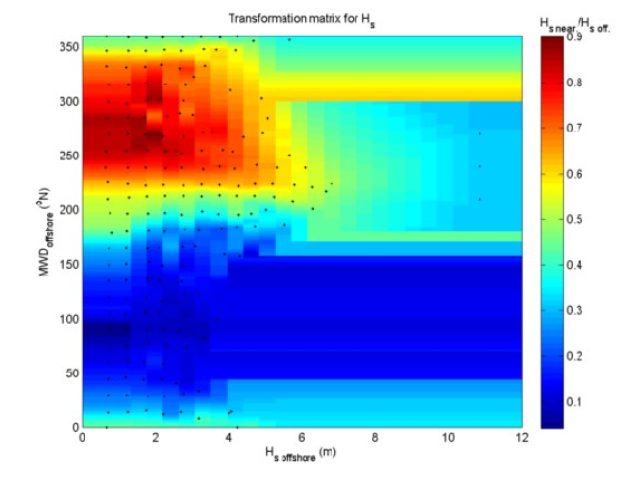
Furthermore, the ORCA Normal Conditions functionality contains a transformation tool that allows, for instance, the computation of nearshore time series of wave parameters on the basis of an offshore time series and scenario computations. This is done by means of non-parametric regression.
Extreme conditions
This ORCA functionality deals with extreme value analysis and includes the possibility to carry out the following analyses:
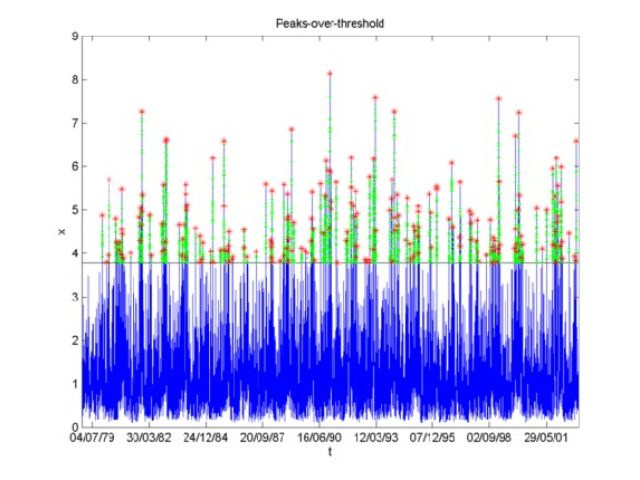
- collection of peak-over-threshold data
- collection of annual maxima data
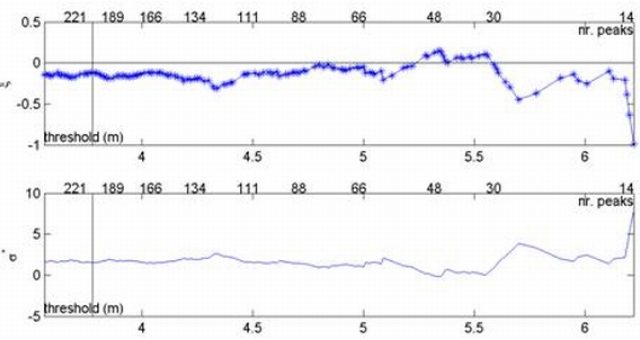
- determination of the optimal threshold for the estimation of the generalized Pareto distribution parameters
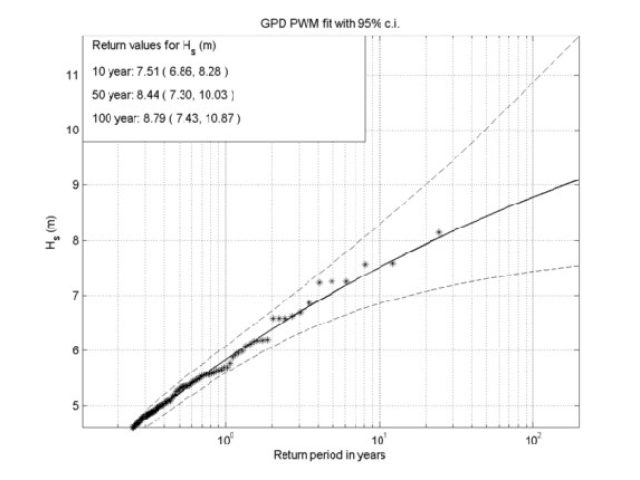
- return value estimation
- fitting of statistical distributions
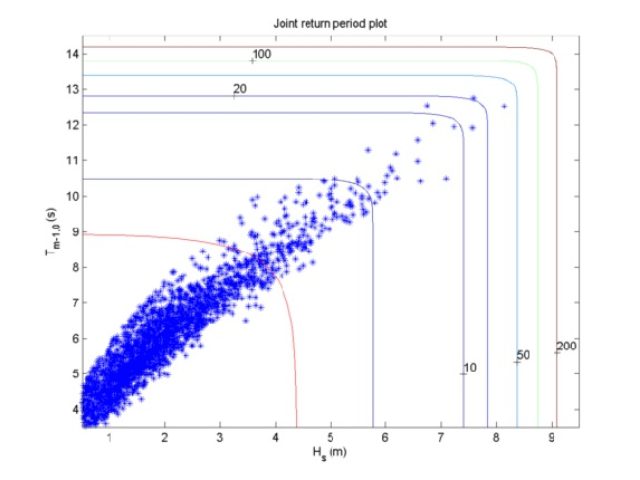
- bivariate analysis
- uncertainty (confidence intervals) estimation
Sea state analysis
This ORCA functionality deals with sea state analysis. There are two types of analyses that can be currently carried out:
Spectral analyses
- Creation of a wave spectrum given certain integral wave parameters;
- Fitting of a parametric spectrum to a computed wave spectrum.
Individual wave height analyses
- Estimation of extreme individual wave heights in a given sea state;
- Computation of the crest height of a given extreme wave height;
- Computation of joint occurrences of individual wave heights and mean wave direction from significant wave height and mean wave direction joint occurrence tables.
Persistence statistics
This ORCA functionality allows the computations of persistence statistics.