
Accurately monitoring sea levels
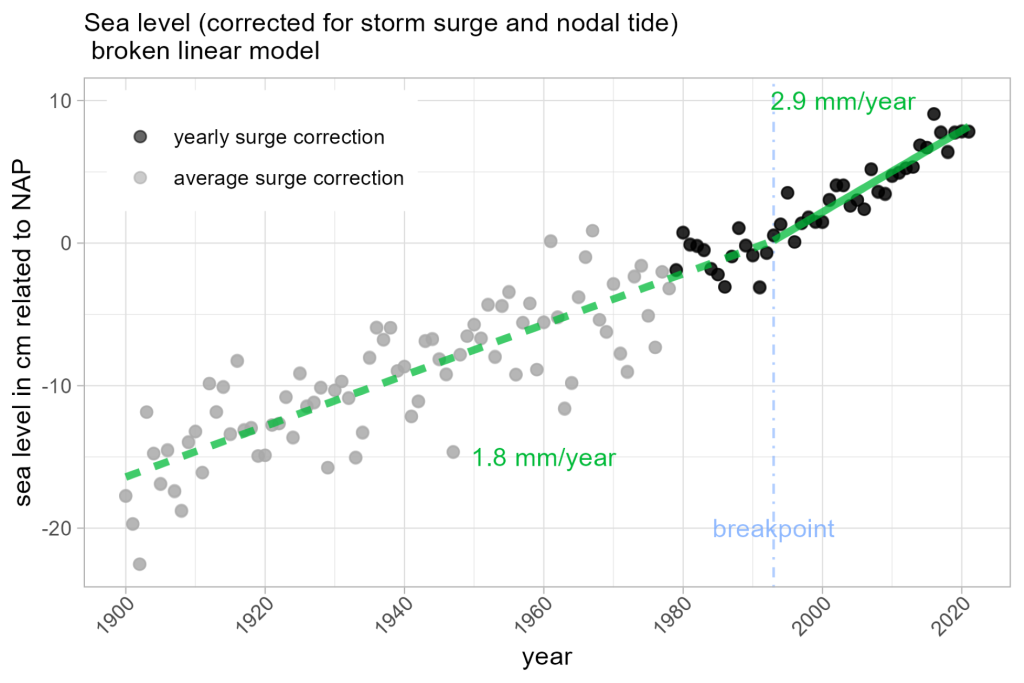
It is important to monitor sea level rise in order to safeguard flood risk management and coastal protection in the Netherlands, now and in the future. The Deltares Sea Level Monitor identifies trends on the basis of measurements. In that way, we can understand the past and look ahead to how sea level rise will develop over the next fifteen years. Until 1993, annual sea level rise averaged 1.8 mm. Since then, the annual average has been 2.9 mm.
On the basis of measurement data, Deltares determines every year, on behalf of Rijkswaterstaat, the average sea level along the Dutch coast. This is a crucial aspect important to understand how sea level rise develops and assessing its impact on flood protection for our country. It helps water management authorities and policymakers to take sound decisions on, for example, strengthening dikes and deciding how much sand to nourish every year to protect the coastline.
From 262,000 measurements per year to an average rise
The Sea Level Monitor uses monitoring data from six tidal stations along the Dutch coast: Delfzijl, Harlingen, Den Helder, IJmuiden, Hoek van Holland and Vlissingen. We have about 262,000 measurements every year that we can use. On that basis, we calculate the average value (the sea level over the course of a year), while also taking into account major influences of wind and tides. Land subsidence at the locations of the tidal stations is also taken into consideration to make the data as accurate as possible. We have brought together the annual figures in a single graph showing the period from around 1900 (when we first had access to sea level data) to the present. Using the trends represented by these data points, it is possible to see the changes in the rise over the years. This information can be used for forecasts covering the next fifteen years.
From 1993 onwards: an annual average rise of 2.9 mm
In addition to publishing the annual sea level, Deltares releases a more comprehensive report every four years that describes sea level rise over the course of the years. The 2014 (in Dutch only) and 2018 (in Dutch only) reports noted that the sea level rose by an average of about 1.9 mm annually since 1900. This provided the best forecast for subsequent years. The 2022 Sea Level Monitor led to a new insight. The measurements from 2018 to 2022 were so much higher than the annual average of 1.9 mm that the straight line could no longer be extended to 2022. Looking back, the shift in the trend occurred around 1993. Since 1993, the rise in the sea level has averaged 2.9 mm annually. The higher trend in the last thirty years is consistent with the global trend of accelerating sea level rise.
2023 and 2024: same conclusion
The sea level data for 2023 and 2024 confirm the 2022 findings. In both years, the sea level exceeded the trend for the previous thirty years. It is noticeable that the sea level in 2023 was slightly higher than expected on the basis of the trend. Outliers of several centimetres of this kind are seen more often but there is not always a clear explanation. A cause can sometimes be suspected. An example is the fall in the sea level after the major eruption of the Pinatubo volcano in the Philippines in the early 1990s, which led to fall in global temperatures. 2023 was an extreme year worldwide in climate terms, with factors such as an El Niño event, which also affected the sea level.
Sea level rise has many causes
The sea level is rising because of a range of factors. Firstly, ice caps and glaciers are melting and so there is more water in the sea. In addition, global warming causes seawater to expand, pushing up sea levels. Changes in groundwater, snow cover and water reservoirs also play a role. Regional variations in sea level rise are affected by factors such as sea currents, wind, atmospheric pressure, and changes in the seabed.
