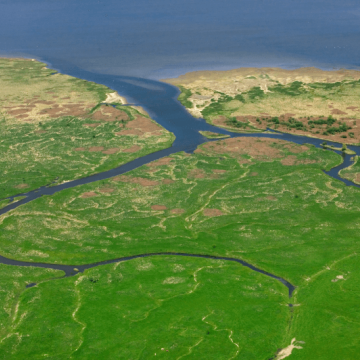
3D visualisation to get the most out of your simulation results
Forecasting water levels and flows have been an ongoing challenge for scientists, mathematicians and civil engineers for decades. Today’s abundance of data and increased computational power open the way to efficiently simulating ever more complex flows. And other processes, such as, sediment transport, waves, water quality, morphological developments and ecology. But understanding these processes is not only about data, modelling, solving equations, high performance computing (HPC) or Artificial Intelligence (AI). It is also a matter of using 3D visualisation technology in order to get the most out of your simulation results. The first results of the new DFX-tool are promising!
The DFX-tool will be the 3D Interactive Viewer of the Delft3D FM Suite. DFX can quickly load and visualise Delft3D FM output files (NetCDF). When georeferenced, a 3D world based on OpenStreetMaps data, elevation maps and aerial tiles can be used for realistic 3D visualisation of your water system. This includes urban areas with 3D buildings, trees, green roofs, water squares, and wadis.
You have not yet indicated whether you want to accept or reject cookies. This means that this element cannot be displayed.
Or go directly to:
You have not yet indicated whether you want to accept or reject cookies. This means that this element cannot be displayed.
Or go directly to:
You have not yet indicated whether you want to accept or reject cookies. This means that this element cannot be displayed.
Or go directly to:
You have not yet indicated whether you want to accept or reject cookies. This means that this element cannot be displayed.
Or go directly to:
Combining the many open datasets available today with the output of the Delft3D FM Suite can instantly result in a clear view of the impact that water contamination, a storm surge, extreme rainfall or a major river levee breach might have on inhabitants (Flood Impact Assessment Tool) and/or critical infrastructure (CIrcle).
How to get a 3D visualisation of my own Delft3D FM output?
Interested in communicating in an effective way? You only need a Delft3D FM output file (NetCDF) and a little support from us to download all data needed from internet. This includes OpenStreetMap data and aerial images, and building the 3D environment. Depending on (1) the data available, (2) the storyline and (3) the type (mp4, 360° video, HoloLens) and number of 3D animations needed, you will get 3D visualisations within 4 hours up to 5 business days.
You have not yet indicated whether you want to accept or reject cookies. This means that this element cannot be displayed.
Or go directly to:

