Time traveling in the Netherlands: Paleo-maps
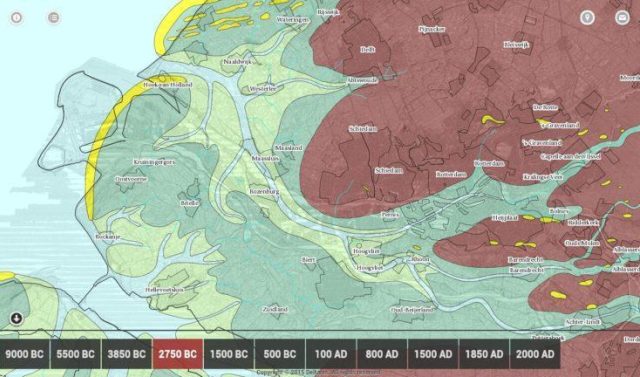
Deltares developed the app, Paleo-maps, to enable the wide public, everyone with a smartphone, to time-travel through the landscape of the Netherlands and become more aware of our past and of the ground layers below our feet. In the app, one can then swipe back and forth to situations in the further past, zoom in and out and locate the current position on the map.
The oldest situation shown is that of 9000 BC when the last ice age had just ended. The impact of (Holocene) sea-level rise and shifting of coasts and rivers is shown in successive maps for 5500, 3850, 2750, 1500 BC, 500 BC. The series continues to 100 AD, 800, 1500, 1850 and 2000, where and when reclamation of the delta plain by humans becomes a second main cause of change.
The heritage of the past
Dramatic changes in the landscape, induced by sea-level change, climate change, and human interventions, are barely visible at the surface. Still, they affect how the Netherlands look like today, why different areas are used for different purposes, and why some areas need to be protected. Furthermore, these past changes show the huge impact of human activities and infrastructure on the landscape and, at the same time, of the influence of extreme natural events on the course of history.
What we learn from the subsurface
This information is recorded in the sand, clay and peat layers below our feet. By collecting and interpreting the geological data in the subsurface of the Netherlands, and by dating the different layers, researchers were able to draw maps of how the Dutch landscape looked like in different phases of our history.
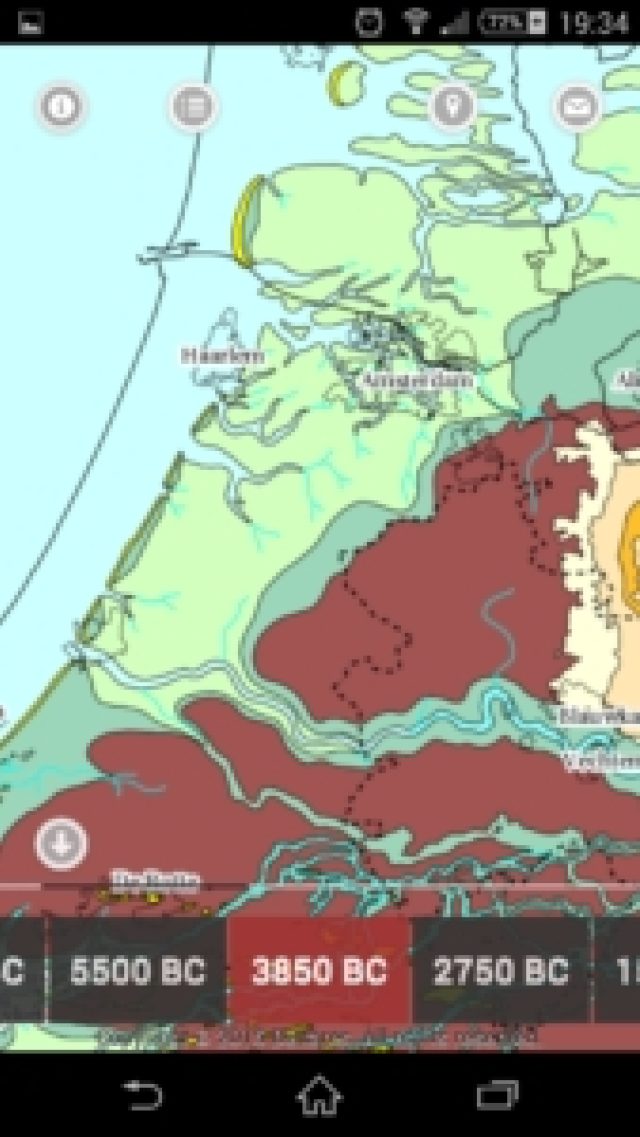
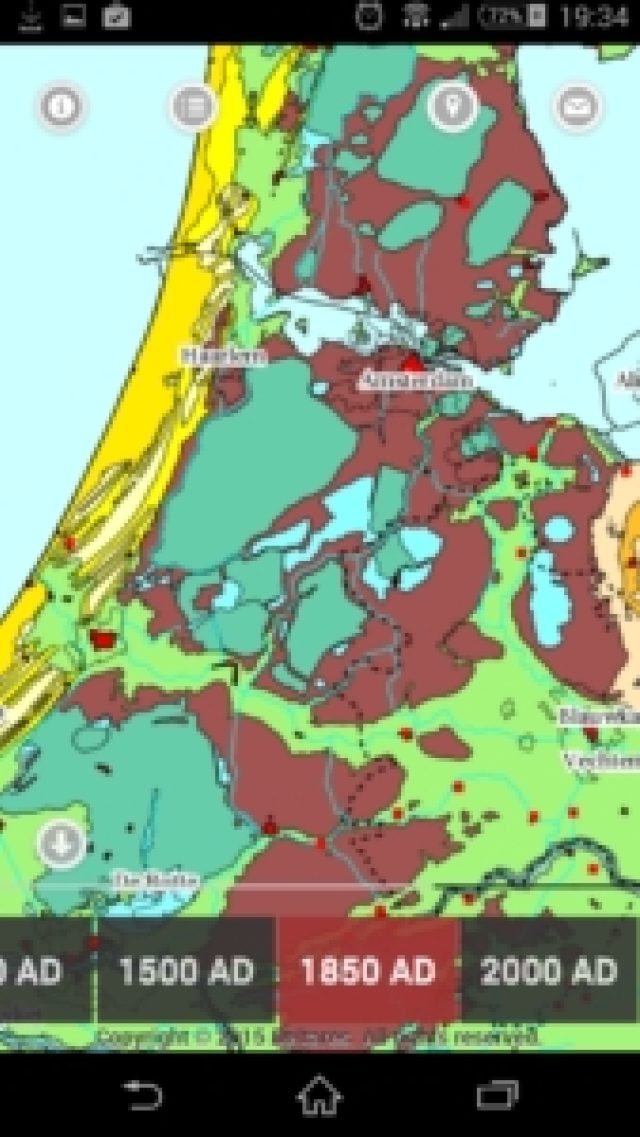
Coastal area of the Netherlands
Paleo-maps of the coastal area of the Netherlands, including the cities of Amsterdam, Leiden and Utrecht. These maps show the landscape elements at specific moments of the geological history. In this case 3850 BC and 1850 AD. At 3850 AD the coastline was positioned much further inland with respect to the present situation, and peat covered a large portion of the region. At 1850 AD, the situation was much different, with reclaimed lowlands and lake floor covering most of the region and a band of sandy dunes protecting the coast from the sea.