
D-Settlement - 1D Geometry
The 1D module supports fast input and settlement predictions for uniformly loaded soil columns and is convenient and quick to use. It allows input of straightforward projects and provides tabulated and graphical output of results both on-screen and in a report. Some specific features include:
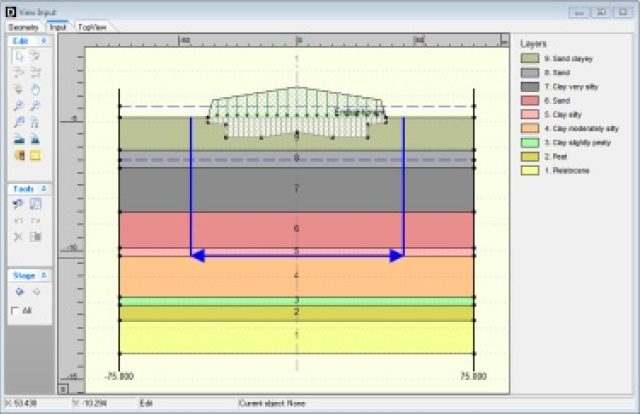
Geometry and loading definition
- Direct import of geometry from other Deltares systems tools.
- Manual input of layers, time dependent piezometric levels and time dependent soil raise via interactive two-dimensional drawing, or via data entry in specific forms.
- A complete choice of additional uniform, two-dimensional and three-dimensional loading types, with different shapes.
- Entry of material properties via forms, or direct import from a central project database.
Soil models with common parameters
D-Settlement calculates the transient 1D settlement along user defined verticals, with one of the following three soil models:
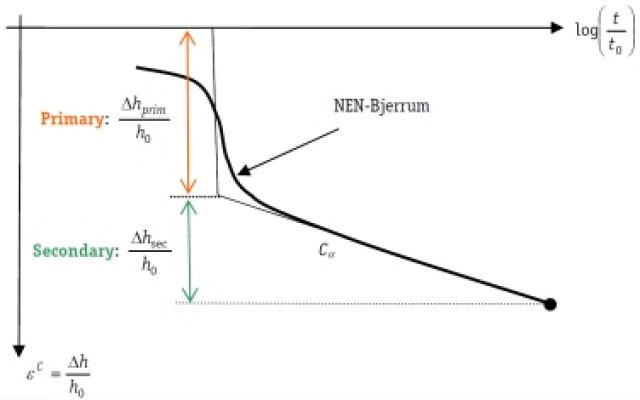
- NEN-Bjerrum supports the common compression index Cc, swelling/recompression index Cr and coefficient of secondary compression Cα . The model and its parameters are based on a small strain assumption. The underlying isotache formulation is suited for staged loading, unloading and reloading. The concept was already introduced by Bjerrum in 1968. It implies that the creep rate increases by loading and reduces by unloading and by time.
- The Isotache natural strain (a,b,c) model is an extension to NEN-Bjerrum, by application of a natural strain description. Natural strain improves predictions in case of large strains.
- Koppejan represents the traditional Dutch model, applicable for staged loading.
Consolidation
The base modules (1D-2D) includes the quick and approximate Terzaghi consolidation model. The input parameter is the common vertical consolidation coefficient. The model multiplies the drained settlement prediction with a so-called “degree of consolidation”. The latter follows from a theoretical elastic solution.
Output
After calculation, D-Settlement offers direct access to graphs of relevant results. All data behind these graphs can also be copied to the clipboard, for instance for use in spreadsheets. Input, warnings and numerical results are furthermore printed in the report. Examples of available graphs are:
- graphs of the settlements and different stress and head components along time and along verticals
- residual settlement versus times at different starting measurements
- bandwidth indication in the settlement prediction
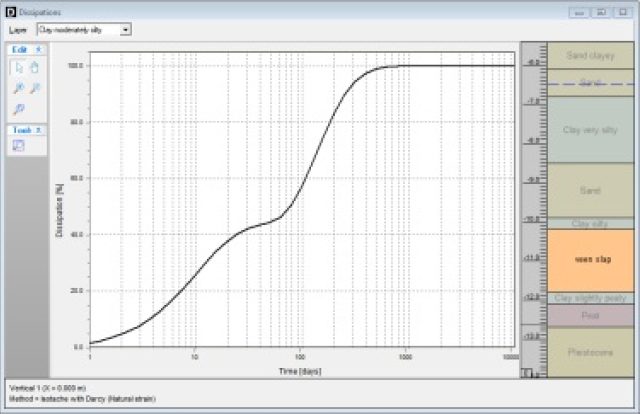
- dissipation graphs per layer, showing the degree of consolidation versus time
D-Settlement comes as a standard module, which can be extended further with other modules to fit more advanced applications.