European Coastal Storm Surge for Copernicus Climate Change Services
Under Copernicus Climate Change Services contract C3S-422-Lot2-Deltares, a consortium led by Deltares develops a consistent and unique European dataset for tide, storm surge and wave conditions. The dataset will consist of a historical reanalysis based on ERA5, and climate projections including sea level rise based on IPCC RCP 4.5 (stabilization of climate change) and RCP 8.5 (strong increase in climate change).
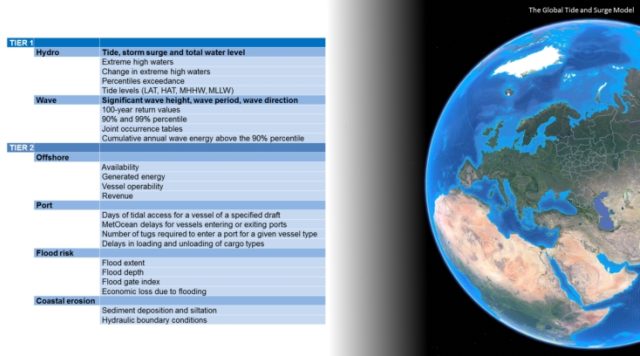
From this dataset a number of Climate Impact Indicators (CII’s) are derived, a selection of which are shown in the below table. Through these CII’s, the various climate change scenarios can be compared with the historical baseline to assess the relative impact of climate change.
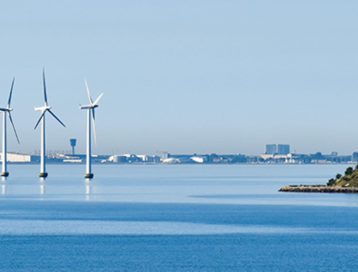
Furthermore, the usability of this dataset to run more detailed local models in order to derive a further set of sector specific CII’s is showcased by a number of use cases. These use cases also provide insights and working examples of the dataset and indicators. They consider a variety of coastal sectors and issues such as flooding due to severe storm surge and wave overtopping, industrial sectors such as offshore wind, harbor and ports, as well as coastal erosion and dune safety. For each sector, a set of tailor made climate indicators is determined.
The use cases cover various coastlines and different parts of the oceans and seas in Europe, such as the North Sea, the Irish Sea (Dublin), the Atlantic Ocean (Galway), the Baltic Sea (Copenhagen) and the Mediterranean (Venice).
Tides and storm surge are modelled using Deltares’ Global Tide and Storm Surge (GTSM) model. The GTSM, as published in Nature Climate Change, is further refined and calibrated for the European coastal waters in view of this. The model resolves changes in both tidal and storm surge conditions due to sea level rise and changing storm conditions in an integral manner. Wave conditions are modelled using ECMWF’s WAM model.
The dataset and Climate Impact Indicators will become part of the Copernicus Climate Data Store early in 2019, to be made available free of charge to the outside world for further research and downstream service development.