Advanced measurement techniques
During consultancy work involving physical modelling, Deltares conducts advanced measurement techniques to investigate physical processes and for the purposes of 2D and 3D numerical software validation. We have high standards for our research, that is why we are constantly improving them so they are accurate, robust and easy to use.
You have not yet indicated whether you want to accept or reject cookies. This means that this element cannot be displayed.
Or go directly to:
Video: Testing and improving new optical wave field measurements in Deltares’ physical test facility the Atlantic Basin, and also in an optically equivalent virtual basin. A test series consisting of various hydrodynamic conditions, both with and without offshore structures i.e. a monopile and an offshore high voltage station was performed. Preliminary results look promising although the (non-intrusive) quantification of the full field seems to come at the price of a bit of accuracy.
Measuring water flow velocity using Particle Image Velocimetry
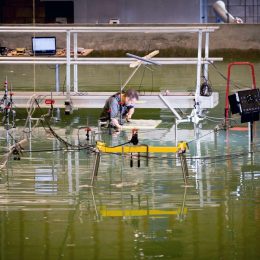
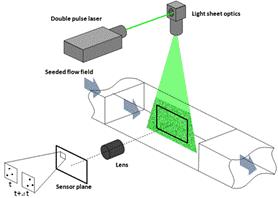
Particle Image Velocimetry (PIV) is a technique for measuring 2D or 3D flow velocity and direction fields in a non-intrusive way (in other words, without disturbing the flow). The 2D version of the technique works as follows: a laser, lenses and mirrors are used to create a thin light sheet to illuminate a 2D plane in the flow. We seed particles into the flow that are monitored in the illuminated plane by a camera. By determining the displacement of groups of particles using image cross-correlation, and dividing this displacement by the time difference between two consecutive images, flow velocity and direction can be measured in detail throughout the 2D domain.
With Delft University of Technology, we are researching possible improvements to the PIV method and applying the method in scale models. We describe three examples here.
2D PIV with LEDs as light source
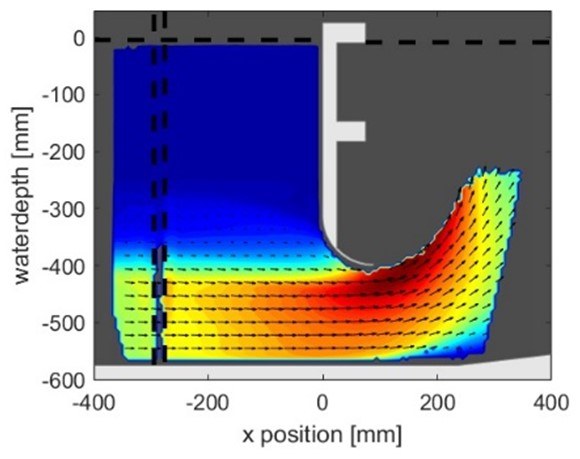
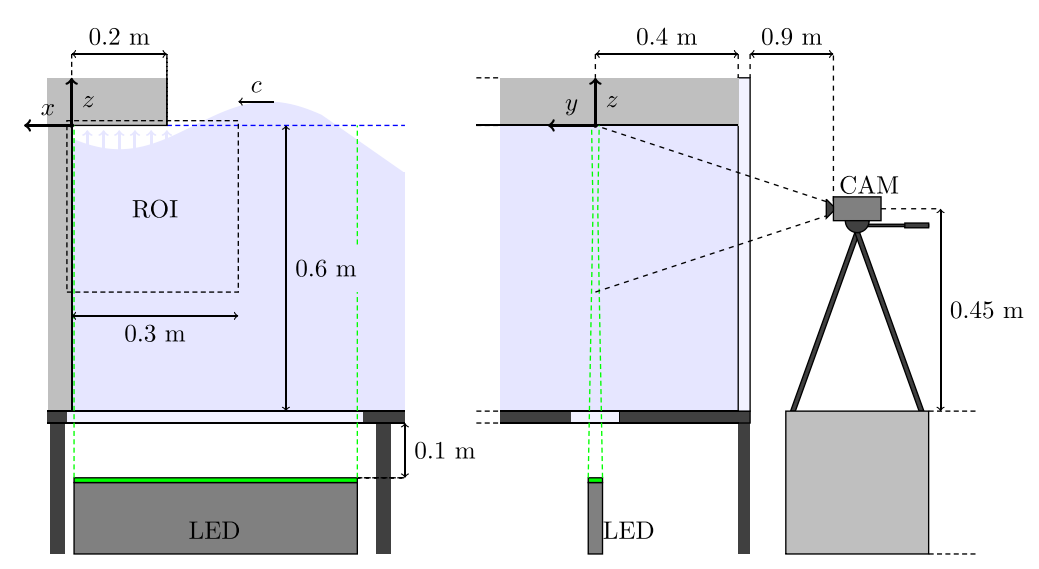
In some applications, such as large-scale models or where very high measurement resolution is not required, an LED array can be used instead of an expensive laser. Working with LEDs is also a solution in laboratories where conditions are slightly less favourable for vulnerable laser equipment. In one of the measurements performed with an LED array, the flow field during a wave impact on a wall with an overhang is the topic of interest.
In some applications, such as large-scale models or where very high measurement resolution is not required, an LED array can be used instead of an expensive laser. Working with LEDs is also a solution in laboratories where conditions are slightly less favourable for vulnerable laser equipment. In one of the measurements performed with an LED array, the flow field during a wave impact on a wall with an overhang is the topic of interest.
You have not yet indicated whether you want to accept or reject cookies. This means that this element cannot be displayed.
Or go directly to:
Video: Measured flow velocity field during wave impact
More information
Portable PIV device (open access design)
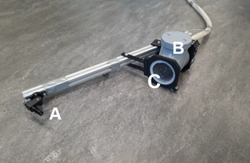
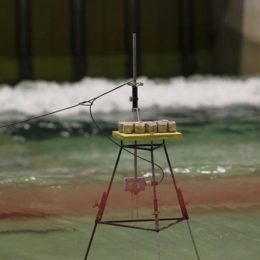
The PIV method is often used in highly conditioned optical laboratories. Application in non-optical laboratories can still be a challenge. That is why we are now working on a portable PIV device. We hope to use it for measurements in facilities where access is less straightforward, such as the Delta Flume, and also ultimately in the field. For example in studies of sedimentation around vegetation, which is important to understand factors such as the dynamics of salt marshes. It should be pointed out here that measurements in the Delta Flume and field observations will remain very challenging for the near future. Because of the importance of the measurements, we want to share the drawings of this PIV device in open access.
You have not yet indicated whether you want to accept or reject cookies. This means that this element cannot be displayed.
Or go directly to:
Video: Flow fields measured below offshore structure during wave passage
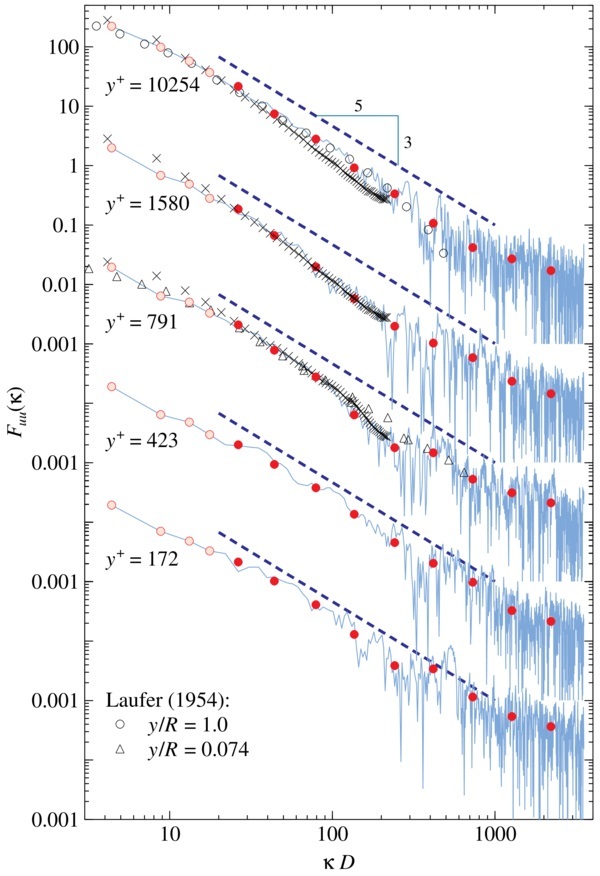
Single-pixel PIV for fundamental research looking at turbulent flows in pipes
Turbulent flows are all around us. Vortices ranging in size from small to very large are characteristic for this type of flow. In the atmosphere, the largest vortices are in the order of 1 km, with the smallest being about 1 mm. By comparison: in the turbulent flow around the wing of an aircraft, the largest vortices are in the order of 1 m and the smallest in the order of a few micrometres. Turbulence in air flows is comparable to turbulence in water.
A classic result of turbulence theory is that the energy spectrum of vortices has a negative gradient of -5/3 for much of the spectrum. We are working on the development of a variant of PIV in which both the velocities and turbulent fluctuations (not only the velocity fluctuations themselves but also the spatial dimensions of the vortices) can be measured at a resolution of up to 1 pixel for statistically stationary flows. The example below shows a flow in the pipe of the Alpha Loop facility.
You have not yet indicated whether you want to accept or reject cookies. This means that this element cannot be displayed.
Or go directly to:
Video: Graphical representation of the algorithm for determining the spatial correlation of velocity fluctuations (vortices) with single-pixel PIV
Stereophotography
Our stereophotography technology measures the bed level around structures. We place reference markers around the structure and take photos from different angles with a double camera. Our internal tools detect the reference markers and determine the camera positions. With the shift between the left and right photo, pixels are converted into 3D coordinates. This way we get an accurate 3D representation of the bed level in high resolution. We mainly use this technique to measure erosion and deformation of scour protections around offshore structures, for example wind turbine foundations. This technique measures the soil around and between complex structures without shadow effects
You have not yet indicated whether you want to accept or reject cookies. This means that this element cannot be displayed.
Or go directly to:
The video shows progressive deformation for a scour protection consisting of concrete mattresses during a sequence of increasingly severe tidal and storm conditions, both as colour images and as elevation values.
Laser scanner
A laser scanner can also be used to measure water elevation over a line with high spatial resolution. We can measure water elevations in small-scale flumes over more than 10 metres and we can measure the wave run-up, including the flow depths of the run-up tongue, in large-scale flumes.